Of the 3 metrics that make up the Core Web Vitals, Largest Contentful Paint (LCP) speaks most directly to your users: it's what conveys the feeling "the page has loaded." It's also, paradoxically, the least optimized. The advice seen everywhere, "compress your images," isn't wrong, but in a large majority of cases, it misses the point.
In this article, we break down LCP as our experts do daily: not as a single number to reduce, but as a chain of four steps, each link of which can be diagnosed and optimized separately. Supported by Google's field data, you'll understand why the real performance potential is almost always found elsewhere than where you're looking, and you'll leave with a complete optimization method, from the server to the pixel.
LCP, what exactly is it?
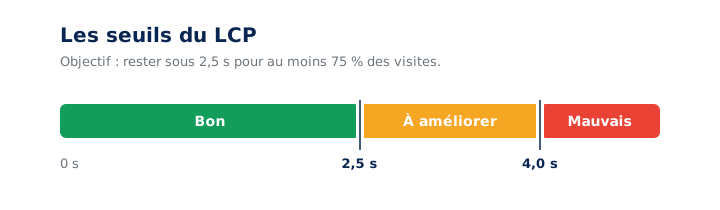
Largest Contentful Paint measures the time elapsed between the start of the navigation and the rendering of the largest content element visible in the viewport. A good LCP is 2.5 seconds or less, bad beyond 4 seconds; these thresholds are assessed at the 75th percentile of visits.
The underlying idea is simple: the largest element is, most of the time, what the user is waiting for to consider that something has actually happened. LCP therefore measures a perception, not an arbitrary technical event, which explains why it has replaced older loading metrics.
This element that qualifies for LCP generally belongs to one of these categories:
- an
<img>tag, the most frequent case (typically a cover or hero image); - an image loaded via CSS
background-image; - the poster of a
<video>tag; - since August 2023, a video or animated image can itself be considered an LCP element, according to the official Chromium changelog; a site with a video banner is therefore directly concerned;
- a block-level text element (a heading, a paragraph) rendered with its font.
To provide a good experience, Google sets a clear goal: an LCP of 2.5 seconds or less for at least 75% of visits. Beyond 4 seconds, it is considered bad; between the two, it still needs improvement.
This precision of the "75th percentile" is crucial. The LCP that matters for your SEO is not the one you measure from your computer on a fiber connection, but the one your real users experience, consolidated by Google in the Chrome User Experience Report (CrUX). A synthetic Lighthouse or PageSpeed Insights test remains an excellent diagnostic tool, but field data is what counts. We will revisit this in detail.
Note: the very definition of LCP has been refined over time to better match perception. As Tim Kadlec analyzes in The growing contentful gap, the LCP calculation has evolved to exclude certain non-significant elements (very low-content images, placeholders), which widens the gap with First Contentful Paint but makes the metric more representative of the moment the user truly sees the main content.
What exactly does LCP depend on?
LCP breaks down into four successive sub-parts: TTFB, the delay before resource discovery, its download time, and the delay before it's rendered on screen. Each can be the dominant cause, and two pages with the same LCP can have radically different profiles.
The main difficulty with LCP is that it aggregates phenomena of very different natures: server time, network time, browser processing time. Optimizing "LCP" in the absolute sense is meaningless. However, it can be broken down into four consecutive sub-parts, with no overlap or gap, whose sum exactly reconstructs the metric. This framework is that of the reference guide Optimize LCP from web.dev.
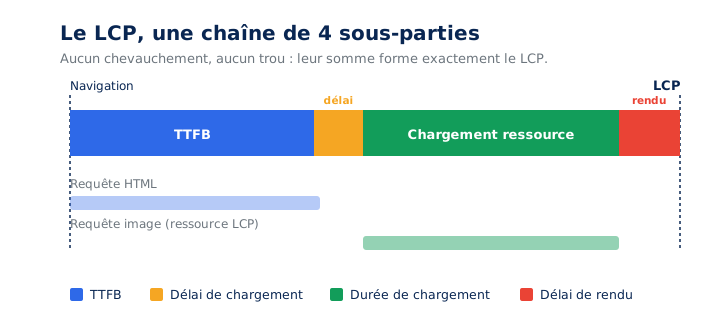
- TTFB (Time To First Byte): the time between navigation and receiving the first byte of the HTML document. It includes DNS resolution, connection establishment, and server processing time.
- Resource load delay: the time between TTFB and when the browser *starts* downloading the LCP resource. If the LCP element is text rendered with a system font, this delay is zero.
- Resource load duration: the time it takes to download the LCP resource itself (most often an image).
- Element render delay: the time between the end of the resource download and its actual display on screen.
This breakdown isn’t just a theoretical exercise: it radically changes how you optimize. Let’s take an example that trips up most people. You identify a slightly heavy LCP image, you recompress it to AVIF, you cut its weight by three. The load duration drops, but the LCP doesn’t budge an inch. Why? Because on this page, the image was actually hidden by JavaScript until it fully executed: the time saved on downloading simply shifted to the render delay. The photo is ready sooner, but it still waits for the same green light to display.
This is the full value of the sub-part approach: it tells you *where* to act, and prevents you from investing energy in a link that isn’t the bottleneck. On a well-optimized page, the ideal distribution looks like this:
- TTFB: about 40% of LCP;
- Download delay: less than 10%;
- Load duration: about 40%;
- Render delay: less than 10%.
The logic is clear: the two sub-parts that include the word “delay” represent downtime, to be reduced as close to zero as possible. The bulk of the LCP should be dedicated to what’s incompressible: delivering the HTML, then downloading the resource. Any moment when neither is loading is an optimization opportunity.
What does real-world data reveal about LCP?
In the real world, the dominant factor is almost never image download, contrary to intuition. It’s the TTFB and the resource discovery delay that consume most of the budget. Optimizing image weight first therefore often amounts to treating the least costly symptom.
When the Chrome teams analyzed LCP sub-parts across millions of real sites, the result surprised even the specialists. The historical advice, “reduce your image weight,” simply doesn’t align with where time is lost. This study is detailed in Common misconceptions about how to optimize LCP.
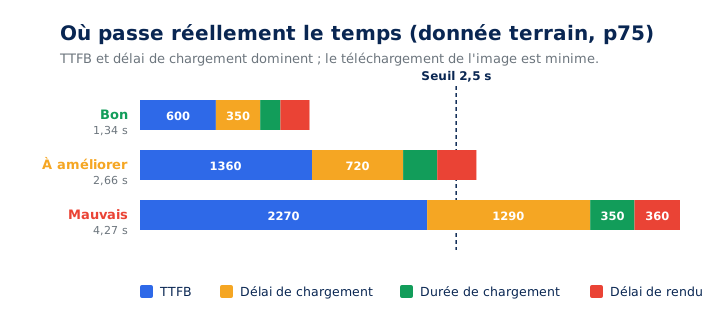
Reading this graph is enlightening. For sites with a poor LCP, the image download duration (350 ms) is the shortest of the four sub-parts. It’s the TTFB (2,270 ms) and the load delay (1,290 ms) that cause the metric to skyrocket. In other words: the majority of struggling sites spend less than 10% of their LCP time downloading the implicated image.
The most telling figure concerns the loading time, that all-too-often ignored dead time: a site with a poor LCP waits a median of 1.3 seconds between receiving the HTML and starting the image download, nearly four times longer than the download itself. More than half of the 2.5-second budget is consumed before the browser even begins fetching the page's main element.
The cause? Almost always dependency chains. The LCP image isn't declared directly in the HTML: it's set by a stylesheet that must download first, or injected by a script that must execute first. Each additional link in this chain further delays the moment of discovery. HTTP Archive data confirms this unequivocally: the median LCP goes from 2.15s without an intermediate request, to 2.54s with one, then 2.85s with two.
Last myth debunked by the numbers: mobile isn't the culprit we imagine. For image download time, a mobile is only 20% slower than a desktop computer on average. Mobile network quality is no longer the excuse it used to be. The real battle is in the loading architecture, not the byte weight.
Is your site as fast as your visitors expect?

How to optimize each sub-part of the LCP?
Address the sub-parts in order of their actual weight, measured on your site: reduce discovery delay, order the head, eliminate render delay, lighten the resource, then reduce TTFB. The order of fixes matters as much as they do, because each step shifts all subsequent ones.
| Sub-part | What it measures | Typical weight | Main fix |
|---|---|---|---|
| TTFB | Server response | Often dominant | Page cache, hosting, database |
| Loading time | Resource discovery | Significant and underestimated | Preload, head order, non-lazy image |
| Loading duration | File download | Generally low | Modern format, compression, CDN |
| Render delay | Display after download | Variable | Non-blocking CSS, fonts, JavaScript |
This grid serves as a diagnostic method: note the actual share of each sub-part on your page, then tackle the heaviest one. A 4-second LCP doesn't have one cause but a profile, and two sites with the same figure often require opposite fixes. Field tools provide this breakdown without special instrumentation.
Armed with this diagnosis, here's how our experts intervene, in the order where the impact is generally strongest. The guiding objective never changes: ensure the LCP resource starts loading as early as possible and displays immediately once downloaded.
How to eliminate resource discovery delay?
It is, as the data has shown, the most profitable lever. The golden rule: your LCP resource must start downloading at the same time as the very first resource on the page. If it starts later, there's time to be gained.
First reflex: make the image discoverable by the preload scanner, that browser component that inspects the raw HTML even before rendering to anticipate downloads. An LCP image whose src (or srcset) is present directly in the HTML is discovered instantly. Conversely, an image injected by JavaScript or hidden behind a lazy-loading data-src attribute remains invisible until the script executes: this is exactly the delay we are trying to eliminate.
We then explicitly signal the resource's importance to the browser using the fetchpriority attribute (available on Chrome 102+, Safari 17.2+, and Firefox 132+). By default, the browser loads an image with low priority while it calculates its role in the layout: fetchpriority="high" promotes it immediately.
<!-- Image LCP directement dans le HTML, priorité haute -->
<img src="/img/hero.avif" fetchpriority="high"
     width="1600" height="900" alt="Description pertinente">
The gain is significant: 5 to 30% on LCP depending on the stack, with an average around 15%, according to Addy Osmani's (Chrome) measurements in his dedicated analysis. Three expert pitfalls to be aware of, however:
- a
fetchpriority="high"should only be applied to a single image, two at most: distributing it over ten resources means prioritizing nothing, and the browser reverts to its default heuristic; fetchprioritydoes not apply to CSS background images, which the preload scanner also doesn't see: if your LCP is abackground-image, convert it to an<img>or<picture>;- the combination of
loading="lazy"andfetchpriority="high"is broken: lazy-loading always removes priority. Never set your LCP image to lazy.
Conversely, off-screen images, such as non-visible carousel slides, can be de-prioritized (fetchpriority="low") to free up bandwidth for the LCP. Finally, if the LCP image can only be a background image, preload it from the HTML to reveal it as early as possible:
<link rel="preload" as="image" href="/img/hero.avif"
      type="image/avif" fetchpriority="high">
How to order the <head> with the CAPO method?
Here is a lever that 90 % of sites overlook, and which directly impacts loading time : the order of tags in the <head>. The preload scanner reads the <head> linearly. A synchronous <script> tag placed before a <link rel="preconnect"> delays the opening of the connection to your image CDN : the connection is only established once the script has executed. That’s milliseconds lost before even discovering the LCP resource.
The CAPO (Critical Above Paint Order) method, formalized by Rick Viscomi of HTTP Archive in Get your head in order, proposes a strict ranking, from highest to lowest priority : first meta charset (which must be within the first 1024 bytes of the document) and <title>, then critical preconnect and stylesheets, and only then scripts, prefetch, and SEO or Open Graph metadata. Ordering the <head> once and for all in the template offers the browser the shortest path to your critical resources.
In the same vein, resource hints deserve to be handled with precision rather than scattered :
- a
preconnectto a font domain or a CORS CDN requires thecrossoriginattribute : without it, the established TLS connection is not reused and a new connection is reopened, negating the benefit ; - limit yourself to three or four
preconnects : each anticipated connection has a cost, and beyond that the browser ignores the subsequent ones ; - track down orphan preloads : a
<link rel="preload" as="image">pointing to an image that the page no longer uses (a common legacy from an old design) triggers a wasted download, and Chrome flags it in the console.
How to eliminate render delay?
Once the resource is downloaded, it must be displayed without delay. However, several culprits frequently delay this rendering :
- synchronous stylesheets or scripts in the
<head>that block rendering of the entire page as long as they are not loaded ; - an LCP element still absent from the DOM, waiting for JavaScript to inject it ;
- an A/B testing tool that masks content while deciding which variant to display ;
- long tasks that monopolize the main thread, where image rendering also occurs.
The most effective workaround is to lighten the critical rendering path. No synchronous scripts should be in the <head>: prefer defer (or async when order doesn't matter), ideally moving it to the end of the body rather than the header.
<!-- À éviter : bloque le rendu -->
<head><script src="/js/app.js"></script></head>

<!-- À privilégier : n'interrompt pas l'affichage -->
<body>(...)<script src="/js/app.js" defer></body></head>
In this area, server-side rendering (SSR) or static site generation (SSG) offer a decisive advantage: the content, including the LCP image, is present in the HTML from the start, without depending on the download and execution of a JavaScript bundle. This is one of the reasons why pure client-side rendering sites structurally struggle with LCP. On this specific topic, our expertise dedicated to Single Page Applications helps overcome the obstacles inherent in modern frameworks.
How to reduce the resource loading time?
The data has reminded us: this is *generally* not where your LCP is determined. But serving superfluous bytes remains a mistake, and on some sites the image is truly the limiting factor. The first lever is the format. The preference hierarchy is clear today: AVIF first (about 50% lighter than JPEG, 20% less than WebP), WebP as a fallback, JPEG as a last resort via a <picture> tag. Be careful though: WebP is not systematically better, as web.dev reminds us; on an already well-compressed image, conversion can increase the file size, and AVIF has a higher decoding cost. An intelligent image pipeline only converts if the gain is real.
Next come the fundamentals:
- serve the correct size via
srcsetandsizes, so as never to deliver a 2000px image to a mobile screen; - provide explicit dimensions (
widthandheight): they prevent layout shifts (CLS) and help the browser reserve space as early as possible; - bring the resource closer to the user with an image CDN, which often optimizes the format on the fly;
- completely eliminate the network for returning visitors thanks to an effective
Cache-Controlcache policy.
<img src="/img/hero-800.avif"
     srcset="/img/hero-400.avif 400w,
             /img/hero-800.avif 800w,
             /img/hero-1600.avif 1600w"
     sizes="(max-width: 600px) 100vw, 800px"
     fetchpriority="high" width="800" height="450" alt="…">
A word about LQIP (Low Quality Image Placeholder). Expert Harry Roberts details a crucial nuance in The ultimate LQIP/LCP technique: a poorly implemented placeholder, revealed by JavaScript, can delay the display of the actual image or blur the LCP measurement. The correct approach lets the final image remain the LCP element, and reserves the placeholder for a light visual effect that doesn't block anything. Finally, if your LCP resource is a font (as in a title using a webfont), a font-display: swap value displays the text immediately with a fallback font, then swaps it without blocking the LCP.
How to reduce TTFB?
Placed last because it's often the one with the least front-end control, TTFB is nonetheless foundational: nothing can happen in the browser until the server has delivered its first byte. Every millisecond saved here mechanically impacts all subsequent steps. This is confirmed by field data: for slow sites, TTFB alone (2,270 ms at the 75th percentile) is almost enough to doom the 2.5-second goal.
Classic causes of high TTFB: cascading redirects (common behind ad links or shorteners), an absence of HTML cache forcing regeneration of each page, or requests bypassing the CDN cache due to unnecessary URL parameters. The solution lies in a robust server cache, infrastructure geographically close to visitors, and controlled network configuration, the very foundation of our high-performance hosting offer.
Can bfcache make LCP almost zero?
Yes. When a page is restored from the back/forward cache, it reappears as-is from memory, without a new load: the measured LCP then drops to a few milliseconds. A simple no-store on the HTML is enough to prohibit this, making it a free gain that is too often lost.
There is a case where LCP drops to a few milliseconds: navigation via the browser's back and forward buttons, served by the Back/Forward Cache (bfcache). This mechanism keeps a complete snapshot of the already visited page in memory: upon return, it reappears instantly, without new loading or rendering. Navigations restored from bfcache report an almost zero LCP, which improves your aggregated field metrics.
However, one must not deprive oneself of it unintentionally. Certain practices disable the bfcache: a Cache-Control: no-store header, the presence of an unload event handler, or certain open, unclosed connections. Chrome DevTools' Application panel offers a dedicated test that precisely lists the reasons for ineligibility. A rigorous audit systematically includes this check, often yielding free gains.
How to measure LCP?
Measure LCP in two places: in DevTools or PageSpeed Insights to identify the responsible element and break down the four sub-parts, and in field data, CrUX or RUM, to know the value actually experienced at the 75th percentile. The lab diagnoses, the field arbitrates.
One principle guides our entire methodology: we do not optimize blindly. Before touching anything, you must know which sub-part is impacting *your* LCP, on *your* real data. An optimization that is relevant for one site may be completely useless for another: that is the whole point of diagnosis by sub-parts.
Concretely, we cross-reference three sources. First, field data (CrUX via PageSpeed Insights or Search Console, supplemented by RUM for low-traffic pages). Good news for diagnosis: since February 2025, CrUX now exposes the sub-parts of the LCP image and network round-trip time, where previously one had to rely on the lab. Then, lab tools (Lighthouse and the Performance panel of Chrome DevTools, which display the details of the four sub-parts). Finally, for continuous monitoring, the PerformanceObserver API:
new PerformanceObserver((list) => {
  const entries = list.getEntries();
  const lcp = entries[entries.length - 1];
  console.log('LCP :', Math.round(lcp.startTime), 'ms');
  console.log('Élément :', lcp.element);
}).observe({ type: 'largest-contentful-paint', buffered: true });
To go further, Google's web-vitals library, in its "attribution" variant, automatically calculates the breakdown into four sub-parts: it is the ideal tool for transforming an abstract LCP into a concrete action plan, directly on your real users.
What to remember about LCP
LCP is not about compressing images: it's a loading chain to orchestrate. Remember the four-step process our experts follow:
- make the LCP resource discovered and started as early as possible (clean HTML, preload scanner,
fetchpriority, CAPO-ordered<head>); - guarantee its immediate display once downloaded (non-blocking rendering, SSR/SSG, free main thread);
- reduce its download time without sacrificing quality (AVIF, responsive images, CDN, cache);
- deliver the initial HTML as quickly as possible (TTFB, server cache, zero superfluous redirects).
This sub-part reading, supported by field data, is precisely what distinguishes an optimization that shifts the problem from one that solves it. This is the core of our business: if your LCP resists despite your efforts, our web performance optimization experts identify the faulty link and fix it permanently. An audit is often the best starting point to objectify your room for improvement, with figures to back it up.