INP, an acronym for "Interaction to Next Paint", is a web performance metric introduced by Google in May 2022 to succeed another performance indicator, FID. Available in beta since February 2023 via the “Experimental” flag, it officially enters the Core Web Vitals this month, on March 12, 2024 to be precise.
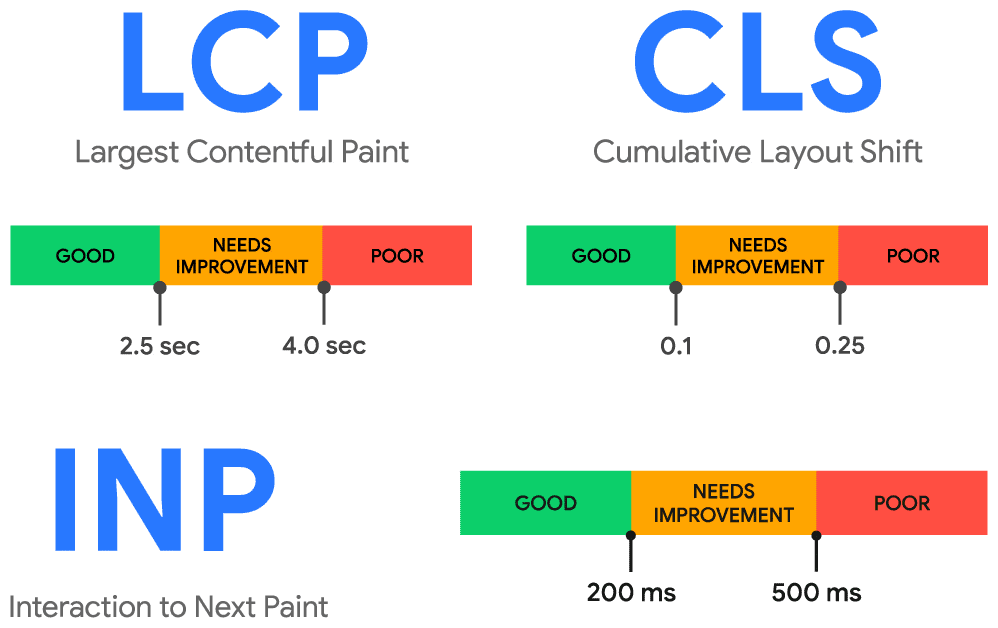
INP measures the delay between a user interaction, click, tap, or keyboard press, and the next visible render on the screen. A good INP is less than or equal to 200 milliseconds, bad beyond 500 milliseconds, these thresholds being assessed at the 75th percentile of interactions.
In this article entirely dedicated to it, we will explain everything you need to know about this web performance metric, and in particular how to ensure you are in the green or, at least, as close as possible. This is a goal you must absolutely aim for, as INP now impacts Core Web Vitals, which themselves constitute a ranking algorithm criterion for Google's search results pages.
Why did INP replace FID?
FID only measured the delay before the first interaction was taken into account, without ever evaluating the time actually needed to respond to it. A page could therefore achieve an excellent FID while remaining frustrating to use. INP measures the entire interaction, from input to render, and across all interactions during the visit.
Before diving fully into INP measurement and optimization methods, it seems essential to revisit the "why". Google and site publishers indeed have three Core Web Vitals metrics that seemed to meet their objectives, didn't they? So why introduce, nearly four years after the kickoff, a new metric and disrupt the habits of site publishers, web agencies, and freelancers?
From Relevance to Quality Measurement
Like many site publishers, web agencies, and SEO experts, part of your monitoring likely involves closely following updates to Google's ranking algorithm. Historically, these updates primarily aimed to ensure content relevance through an increasing number of complementary mechanisms:
- identification of low-quality texts (spam in particular), duplicate content, and more recently, AI-generated content;
- improvement of authority-related scoring through detection of “unnatural” link-building techniques: spam, link purchases, satellite site networks…
Since 2020, Google has supplemented its “Core Updates” and other “Spam Updates” with a new type of update aimed at estimating the quality of web pages and sites. With these, the American giant aims to assess user satisfaction levels, and not just the intrinsic relevance of content and its popularity. This UX-oriented approach is, for them, the best strategy to ensure they maintain their leadership in online search.
However, evaluating and even more so measuring the User Experience is not simple: it is a vast field that, on the web, involves professions as varied as web design, security, accessibility, and front-end development. It is with this in mind that Google deployed its “Page Experience” component, which is partly based on the “Core Web Vitals” – which were once translated into French as “Essential Web Signals”. And this is what we will discuss now.
Core Web Vitals to measure the real User Experience
The “Core Web Vitals” are a set of metrics designed by Google engineers to mathematically measure the quality of the User Experience. To collect numerical data for a component that, from a user's perspective, largely involves the subconscious and emotions, they had to define the basics of what web performance concretely is. This approach allowed them to identify three key components, each represented by a metric.
Perceived speed: LCP
LCP, an acronym for “Largest Contentful Paint,” aims to calculate the loading speed perceived by users. While the Speed Index would have been more relevant for this exercise, Google had to deal with the reality on the ground by opting for an indicator that is less costly to calculate. This is why LCP calculates the time it takes to display the main visible element in the viewport when a page initially loads.
In practice, the correlation between Speed Index and LCP is significant, making LCP a highly relevant metric. If only one were to be kept, it would undoubtedly be LCP.
Visual stability: CLS
CLS, an acronym for “Cumulative Layout Shift,” aims to calculate the consistency of a web interface over time. Indeed, there is nothing more disruptive for a user than navigating a page in which elements move in an anarchic way. The goal is to ensure that interactions with a page result from the user's intent and not from poor handling. It's an excellent way to measure potential frustrations.
The indicator once again plays its role perfectly here, providing precise insight into the technical issues of pages.
Interface responsiveness: from FID to INP
It is within the framework of this third part that we get to the heart of the matter. Since the introduction of Core Web Vitals in 2020, page responsiveness has been calculated using FID, an acronym for “First Input Delay.” An indicator that is particularly explicit since it translates in French to “First input delay,” and that's precisely what it measures.
However, FID was not very representative of the real user experience in terms of responsiveness, for two main reasons:
- it only measured the first interaction, but not the subsequent ones. However, users spend an average of 90% of their time navigating a page, so the first interaction represented only a tiny fraction of what they actually experience;
- it only measured the latency before the execution of JavaScript, and not the complete latency as perceived by the user. The delta could thus be significant between the two, with FID largely underestimated most of the time: the first threshold of 100 ms was rarely reached, causing the metric to lose its interest.
It is to correct these shortcomings that INP, an acronym for “Interaction to Next Paint,” was introduced. With this new metric, we place ourselves from the user's point of view: what we seek to obtain is a visible result on the page, and no longer the execution of a meaningless JavaScript callback function. And this throughout navigation sessions, and no longer just during page loading.
It is, at the moment when a user leaves a web page, the maximum value that is taken into account and becomes the INP from the perspective of Core Web Vitals. This approach makes sense insofar as it aims to ensure that the performance level is consistent over time.
How to measure INP?
Measure INP in the field as a priority, via Chrome data or a RUM tool, as it depends on your visitors' real interactions. In the lab, DevTools and the Web Vitals extension allow you to reproduce an interaction and isolate its cost. No synthetic tool can guess your users' interactions.
As with other Core Web Vitals, engineers have established a precise methodology for calculating a page's INP. The goal is that regardless of the tool used, the results are consistent.
How is INP calculated?
Unlike its predecessor FID, INP can currently only be obtained through Chromium-based web browsers, namely Google Chrome, Microsoft Edge, Opera, and Samsung's mobile browser. Neither Firefox nor Safari have access to such an API. Let's now see how the metric is concretely calculated.
Three steps instead of one
As we saw earlier, INP goes further than FID in terms of measurement. During an interaction such as a click, a touch on a touchscreen, or a keyboard input (but not scroll or hover), the metric is calculated by adding the duration of three main steps:
- the input delay, which notably includes FID and calculates the latency between user input and the triggering of the corresponding event;
- the processing of the interaction itself via JavaScript, CSS, or the browser's native functions;
- the on-screen display of the updated page, which involves a rendering and paint phase (detailed more precisely later).
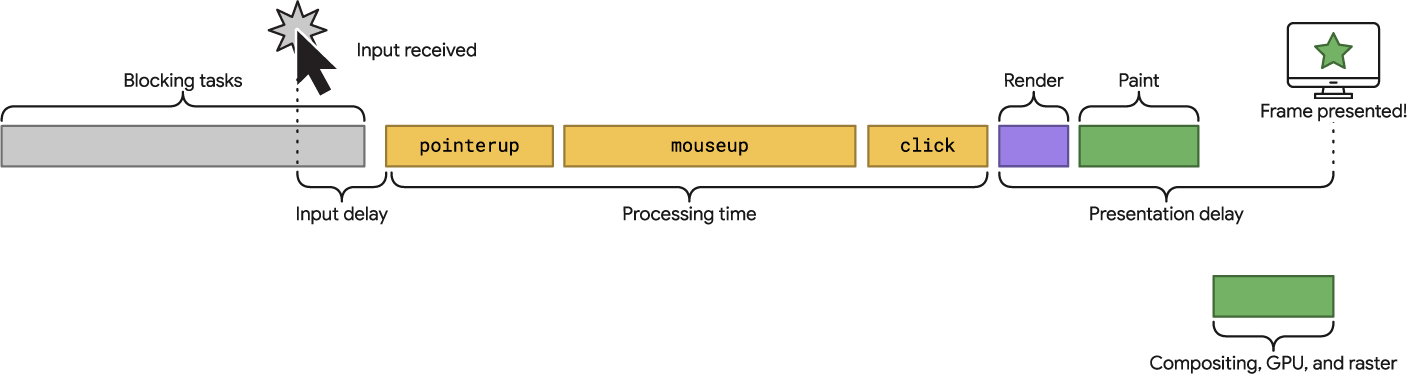
Since this data is time-based, the unit of measurement for INP is milliseconds. To provide a quality user experience in terms of responsiveness, Google engineers estimated that it was necessary to be under 200 ms. The threshold is thus more generous than for FID, which makes sense as more elements are measured. Conversely, exceeding the 500 ms threshold (half a second) causes the indicator to fail.
High variability
We explained that INP measures a sum of latencies and processing times without detailing why it could take time. The answer is right before your eyes: it's your hardware, and more specifically your microprocessor's processing power and the amount of RAM it has. JavaScript execution and visual rendering are two extremely costly operations for a CPU, which executes a majority of the processing in a single calculation thread (referred to as "thread" in English).
Consequently, the latter quickly and regularly reaches saturation, which generates the famous “Long Tasks” (more than 50 ms of execution time). This translates concretely into a very large variability in the metrics collected from users: a desktop visitor will not have the same performance level as a mobile user. And even between smartphone users, the operating system, system settings, or the browser constitute so many factors of variability.

As Google's objective is to provide metrics that are understandable and actionable by site publishers, the data is systematically divided between mobile users on one side and desktop users on the other. A logical grouping given that the experience between these two families of devices can differ: screen sizes, pixel density, input methods, level of attention... We are indeed facing two totally different experiences.
75th percentile over 28 days
Given the variety of experiences, it is not feasible for most sites to aim for a 100% performance objective, for INP as for other metrics. Based on this observation, Google has opted for an approach based on 75th percentile thresholds. This means that to validate INP, at least 75% of your users must benefit from a good INP (under 200 ms, therefore).
This approach is widely accepted as it guarantees good representativeness (unlike the 50% threshold used previously) while not being as demanding as the 90th percentile threshold sometimes mentioned within Google teams. Nothing is more motivating than an achievable goal.
When analyzing the data of a URL or an Origin in a report provided by Google, the 75th percentile is represented by small black pins. Each is topped with a value that corresponds to the consolidated 75th percentile for all users.
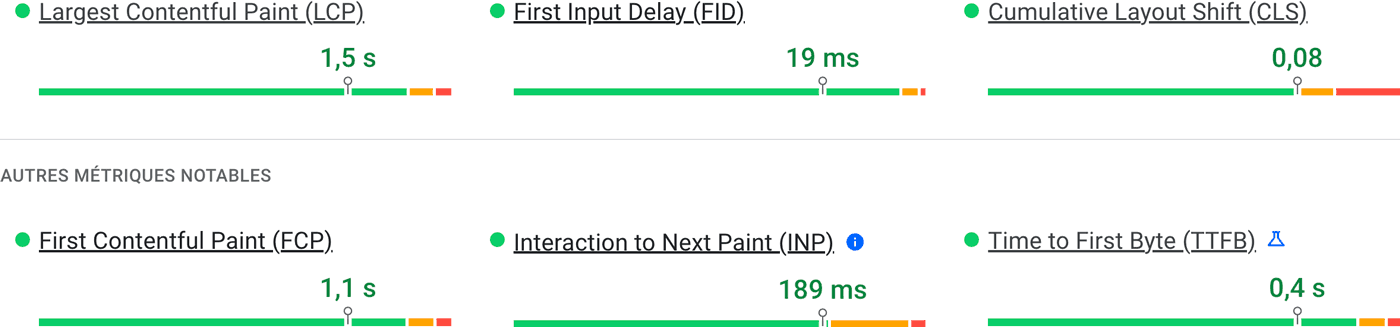
Finally, it should be noted that for computational cost reasons, data shared by Google is smoothed over 28 rolling days. This form of inertia makes it difficult to use data from Google's official tools to monitor performance. On the other hand, it avoids the "roller coaster" effect that would lead to massive alert dispatches at the slightest update or cache clear.
With what tools to measure INP?
As we started to see, Google collects INP via its Core Web Vitals browser API. But is it the only one doing so? And how can such data be used to drive a web project and make the right decisions? We will list the tools that answer these questions together.
The Chrome User Experience Report
We have already extensively covered the ecosystem of tools developed by Google without having introduced it. This oversight is now corrected with a proper and formal presentation of the "Chrome User Experience Report," or "CrUX" for short. The tool is a gigantic database where performance data collected from users via the famous API integrated into the Google Chrome browser is stored.
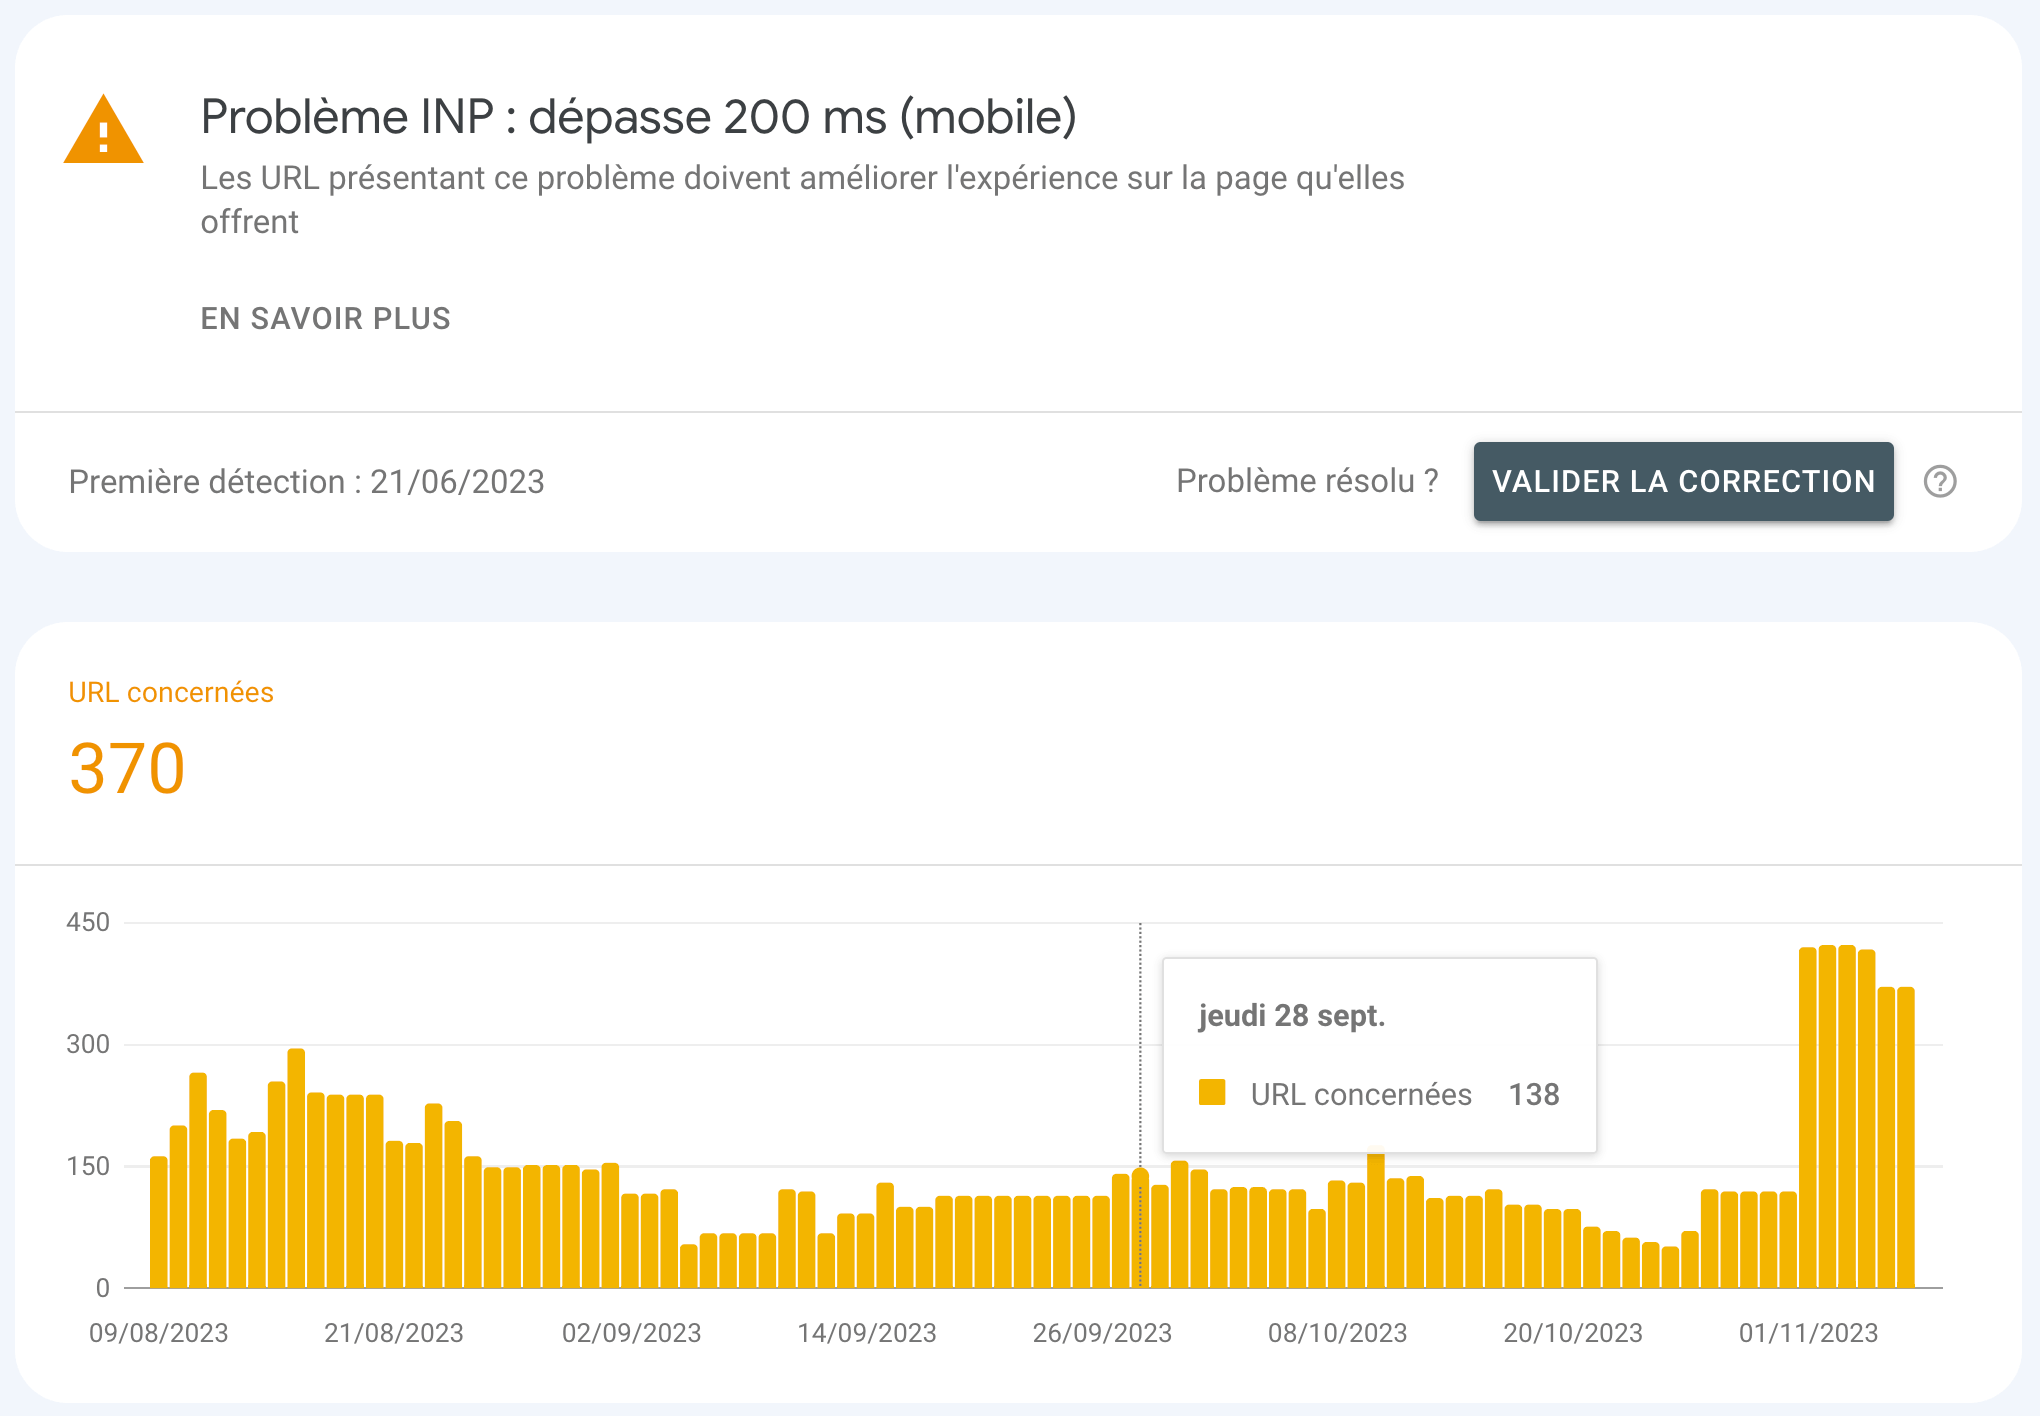
CrUX data is what Google uses for all of its reports: Core Web Vitals in Search Console, the "Discover your user experience" section in PageSpeed Insights reports… As this data is freely accessible, it is also available via APIs and BigQuery, allowing you to go far beyond what Google offers in terms of formatting and freshness.
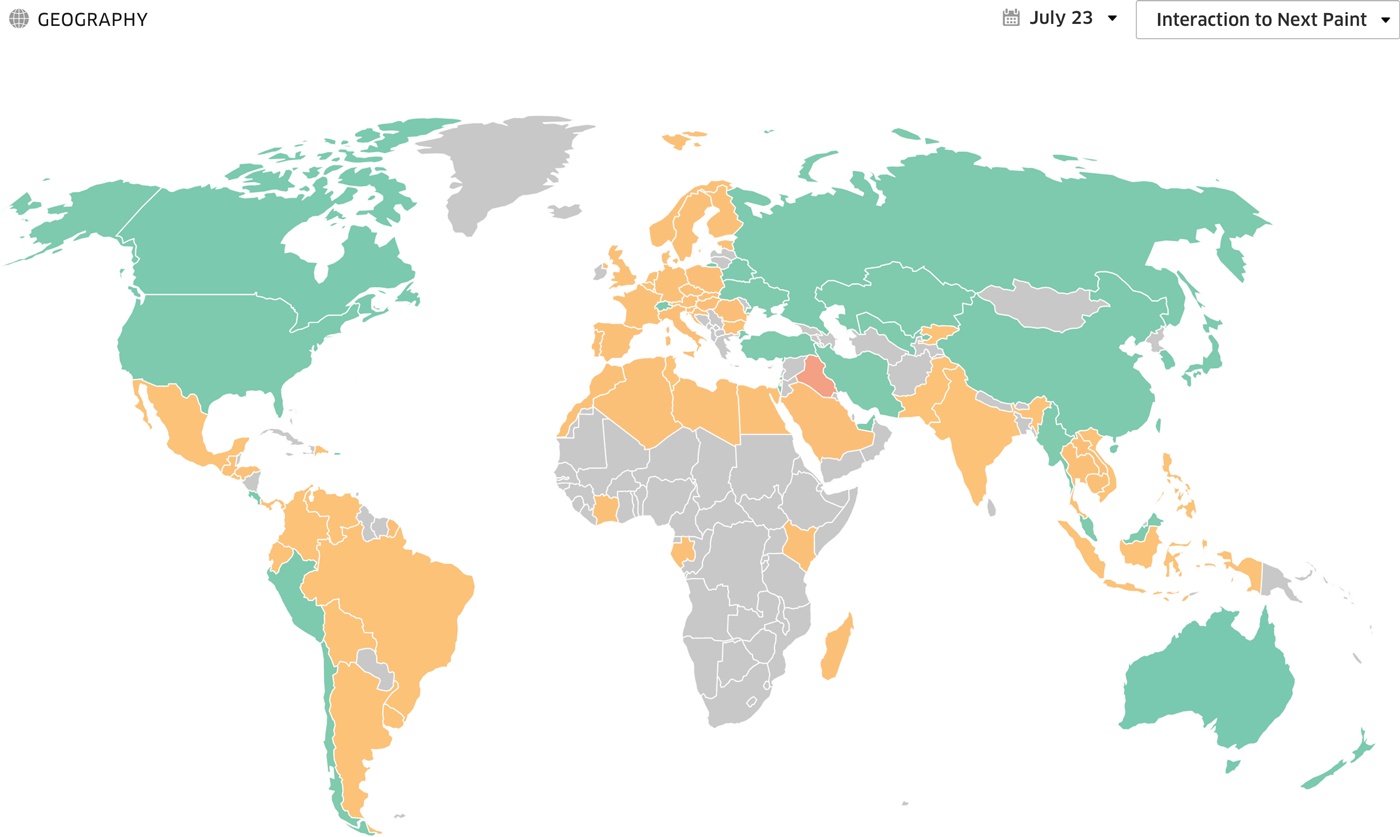
If you want to go beyond the meager interface offered by Google in its Search Console or access recent data, we recommend using a third-party tool like Treo or Speetals. These tools are capable of retrieving CrUX data to format it more intelligently, thus taking advantage of truly operational dashboards. They notably allow filtering users by geographic origin or consulting the 3-year history.
Field data
The great strength of CrUX is its fully integrated and automated operation: data is collected no matter what, without any solicitation from site publishers. But just because this data exists unconditionally and for free doesn't mean it should be at the heart of your web performance optimization or monitoring strategy.
It is indeed possible to collect this same data via a JavaScript tag, which incidentally removes the multiple constraints inherent to CrUX. The sample is notably expanded, as an increasing number of metrics are available within browsers like Safari and Firefox (LCP notably since version 122). Depending on the configuration adopted, "Real User Monitoring" ("RUM") tools also allow for in-depth analysis of the collected metrics:
- highlighting unique visits vs. multi-page visits where the browser cache significantly improves performance;
- highlighting page views that leverage the improved cache mechanism, or “Back Forward Cache,” which guarantees very low metrics;
- highlighting pages with a hidden visibility state: when opened in a hidden tab, pages generally show significantly reduced performance;
- creating relevant page groups for a given activity. Example: category pages, product pages, and SEA landing pages for an e-commerce site.
On the INP side, RUM tools can additionally be used to retrieve interaction data to identify the components responsible for interaction latencies. This contextualization adds significant value because, unlike LCP and CLS, INP is only available within field data since it requires navigating through pages.
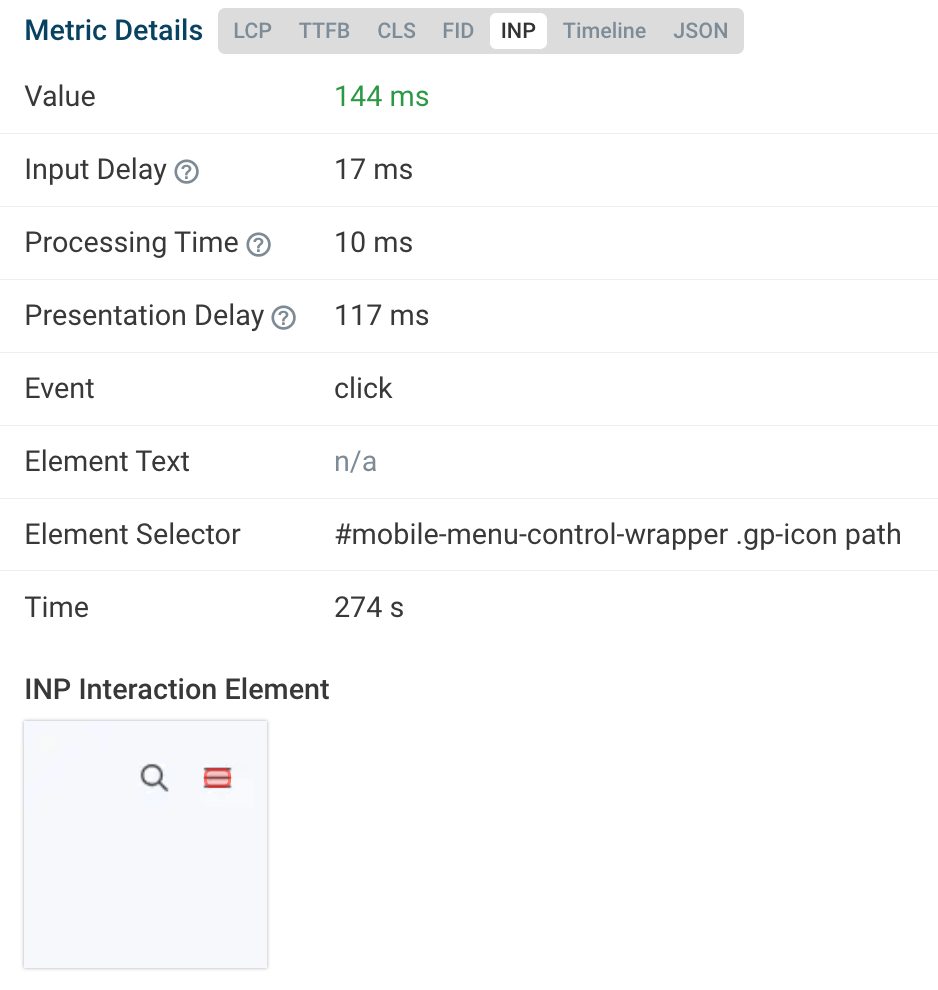
To integrate such a feature into your technical stack, you will be spoiled for choice. The various tools on the market all rely on the native Performance API, which allows you to retrieve user data via the JavaScript method performance.getEntries() or via a PerformanceObserver instance. In theory, it is even possible to develop your own data collection, processing, and display tool.
But the most accessible solution is to turn to a SaaS solution like Request Metrics, RUMvision, DebugBear, Dynatrace, New Relic, Raygun, or Contentsquare. Keep in mind, however, that these require the deployment of front-end JavaScript… and can thus generate Blocking Time and contribute to an increase in your INP. So, it's up to you to decide if it's worth the effort.
Synthetic data
Synthetic data are collected by a family of tools that perform tests under so-called “laboratory” conditions. The idea is that they reproduce a user visit with a well-defined context: network bandwidth and latency, CPU power, screen dimensions and pixel density, user agent… Their main advantage is comparison, either with competing pages or over time. They are particularly excellent tools for monitoring performance and quickly identifying potential performance regressions.
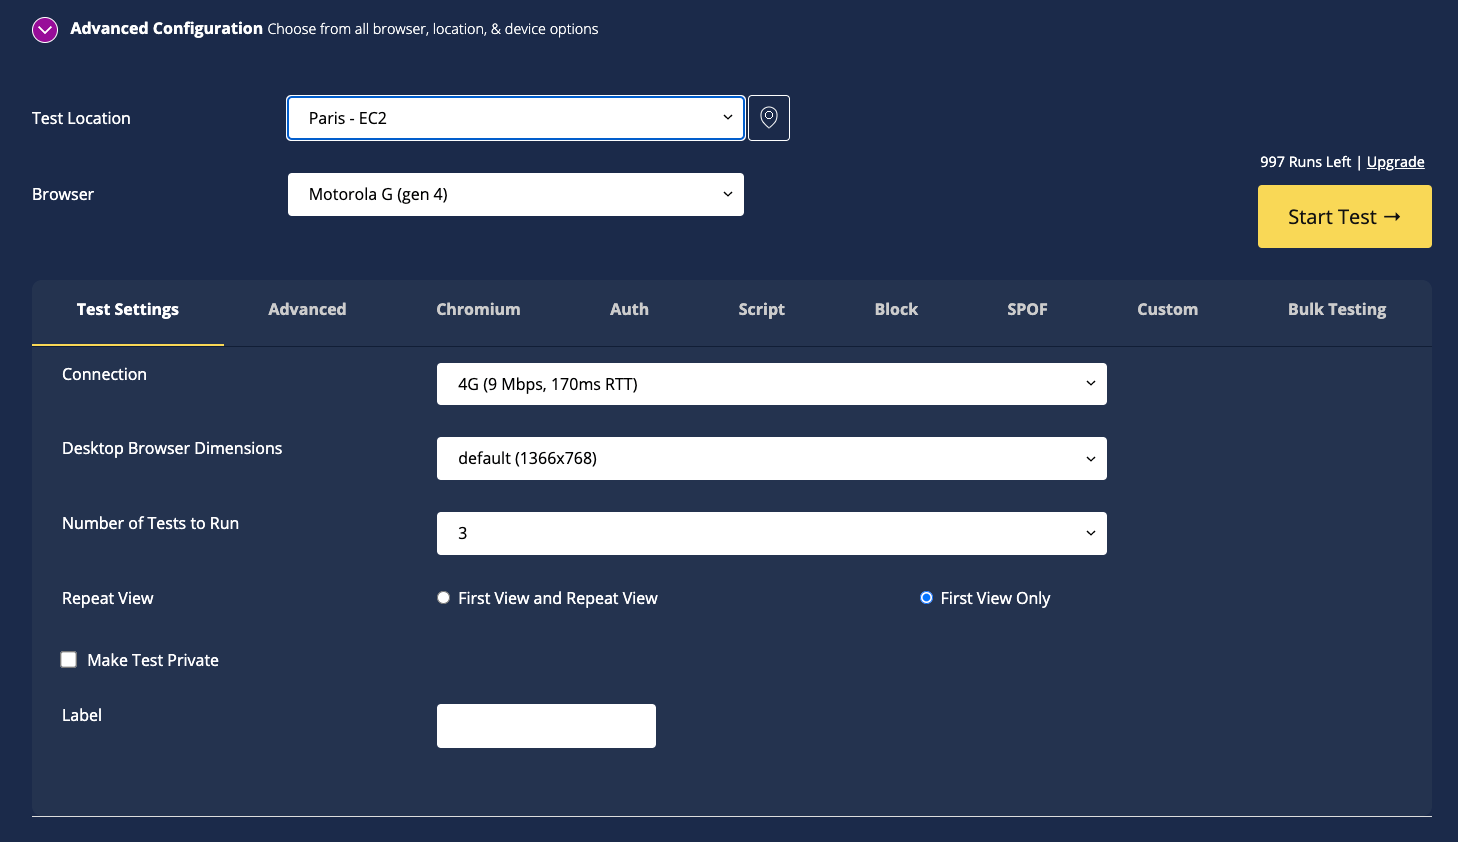
As mentioned previously, INP is not available in these types of reports, and for good reason: it concerns bots that do not interact with pages like real users do. The solution is to turn to the "Total Blocking Time" ("TBT") metric, which correlates very strongly with INP. Both are indeed highly dependent on the volume of JavaScript executed.
Many players offer tools of this type, the most popular being WebPageTest, GTmetrix, Treo, and Contentsquare Speed Analysis. For a comprehensive view of performance, it is advisable to monitor both field data and synthetic data.
Your browser's developer tools
Because you are, after all, a web user like any other, there is nothing stopping you from using your own web browser to test the performance of your site and identify potential weaknesses in INP. Google Chrome's developer tools, also known as "DevTools," have an extremely sophisticated tool designed specifically for this: the "Performance" tab, accessible via the menu then "More tools."
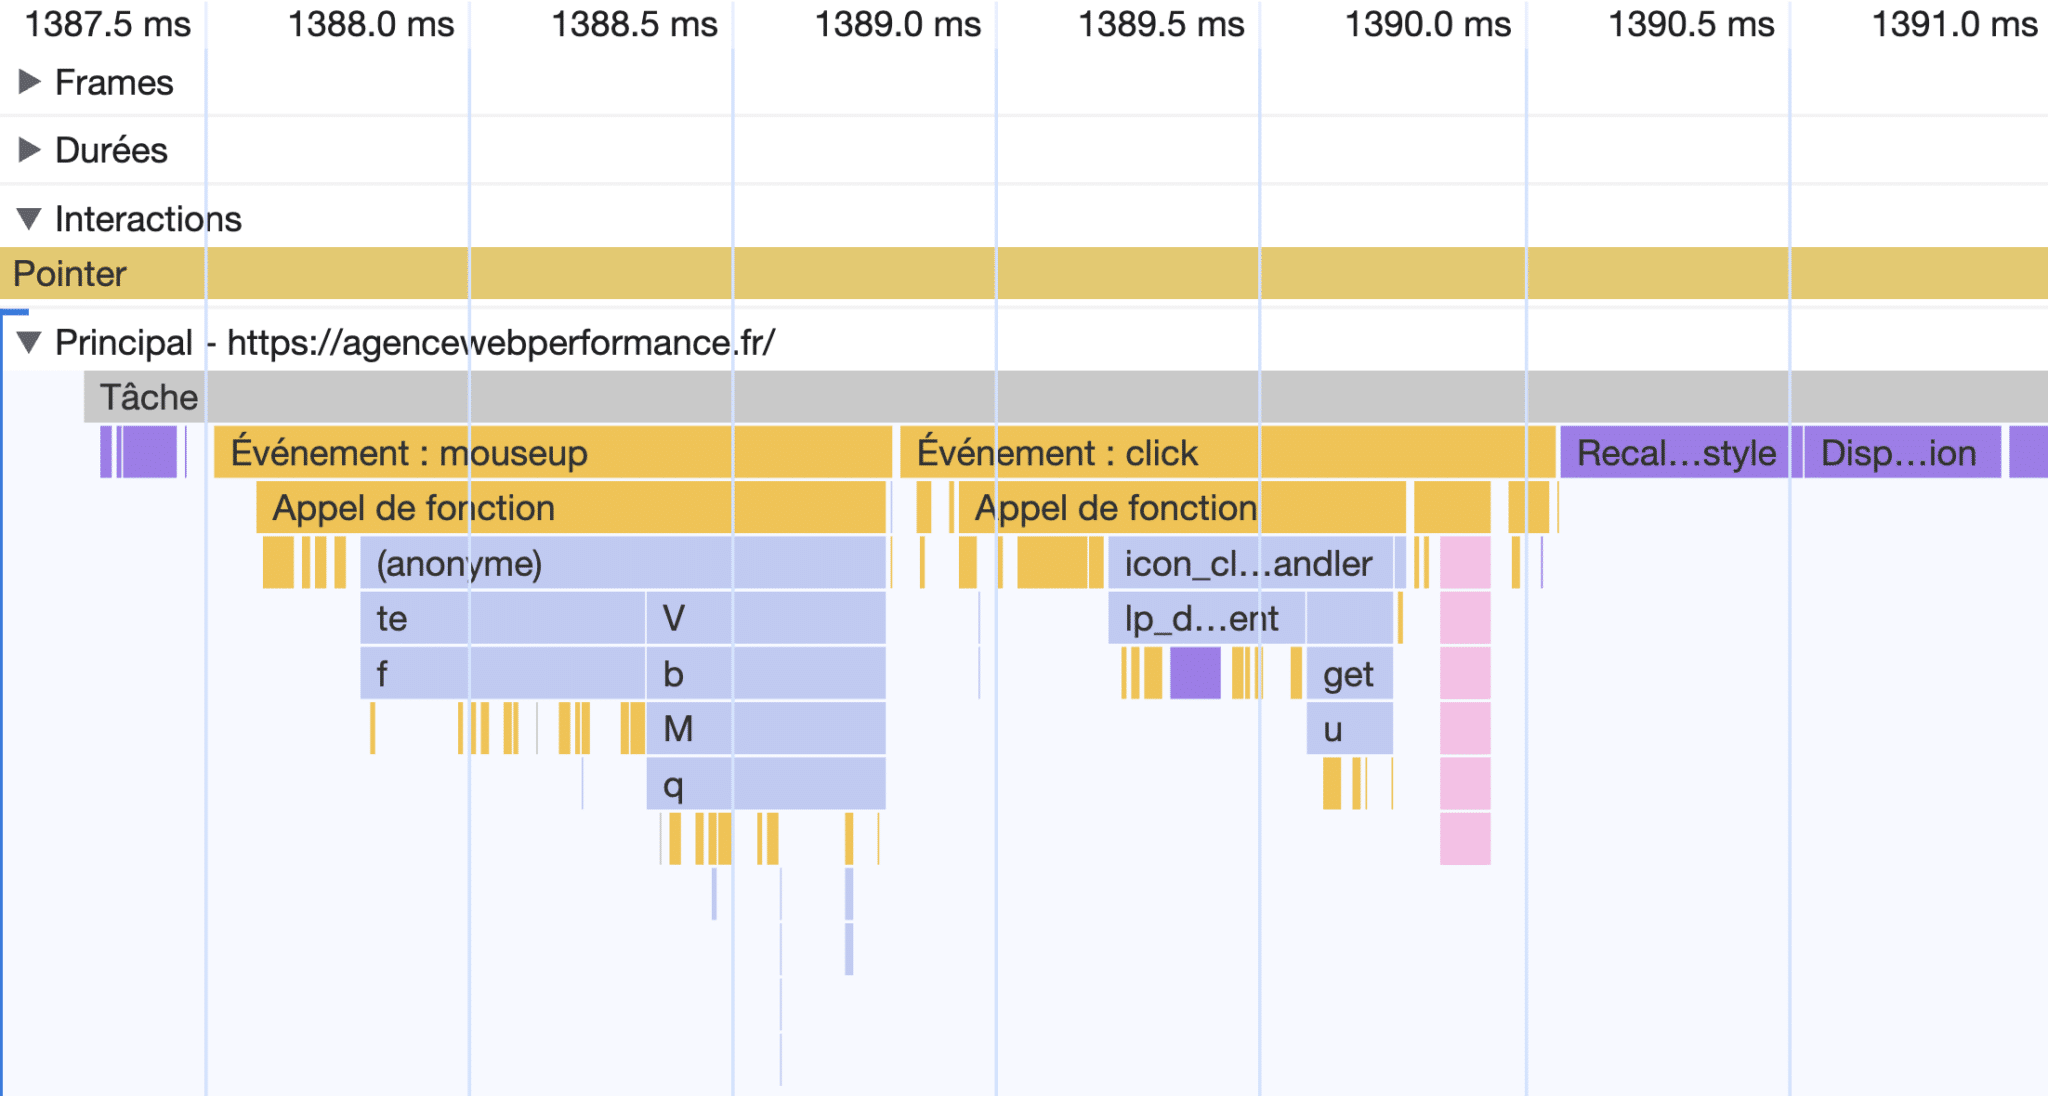
Using it, particularly reading its timeline and "flame graphs" (so named due to their visual appearance), allows you to identify the JavaScript code triggered after each type of interaction, as well as the repaint and reflow operations performed by the browser in its wake. Ideally, the main task should be as short as possible and the number of triggered elements as low as possible.
For technical profiles, this is the ideal place to identify THE JavaScript function that is penalizing your INP. We should also note Google's recent efforts to make the tool more understandable (see the changes in Chrome 121).
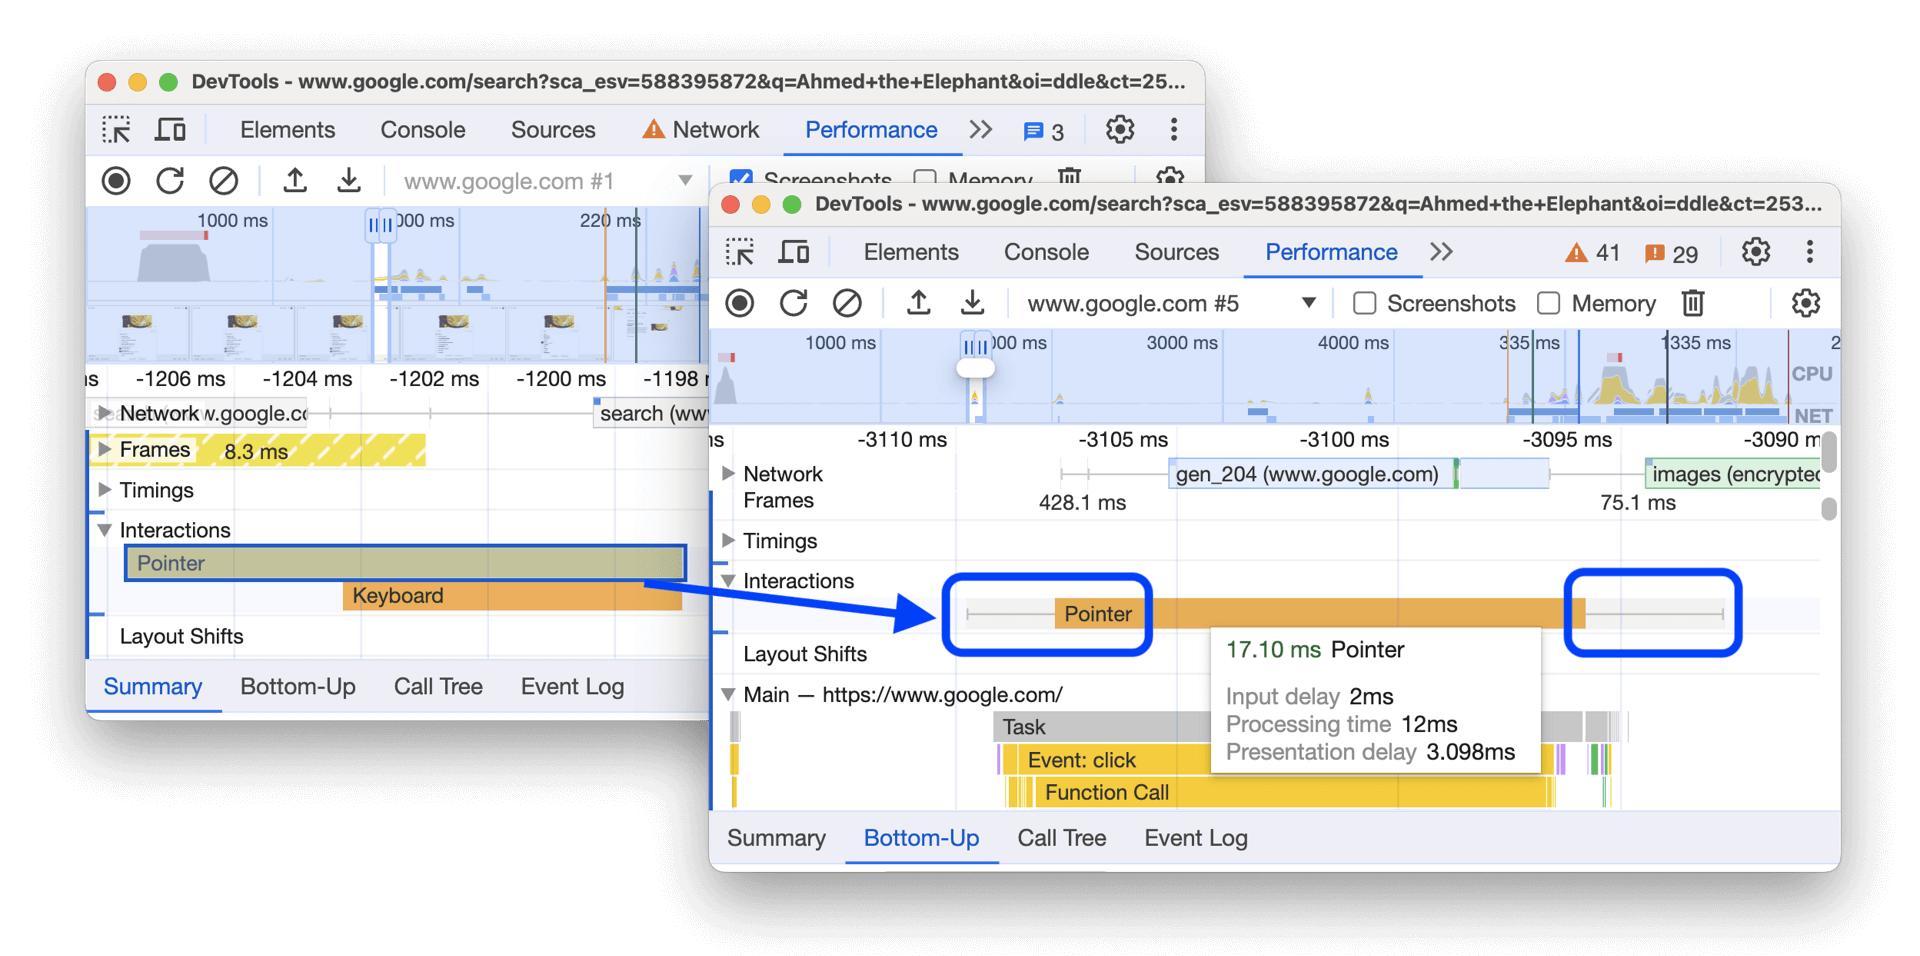
We will not go into an in-depth analysis of this tool, as understanding it requires solid front-end web development skills. Fortunately, there is illustrated documentation and, for the more motivated, even more advanced solutions for precisely profiling the "traces" generated by browsers. It is indeed possible to export them in JSON format to view them using tools like Perfetto UI.
The official Web Vitals browser extension
For less technical profiles, there is a "Web Vitals" extension for Google Chrome. After enabling metric logging in the console via its options, it displays in real time all the data collected by the Web Vitals API integrated into Google Chrome. Each interaction with a page thus logs an Interaction event, with a breakdown of the three stages that constitute it within a table.
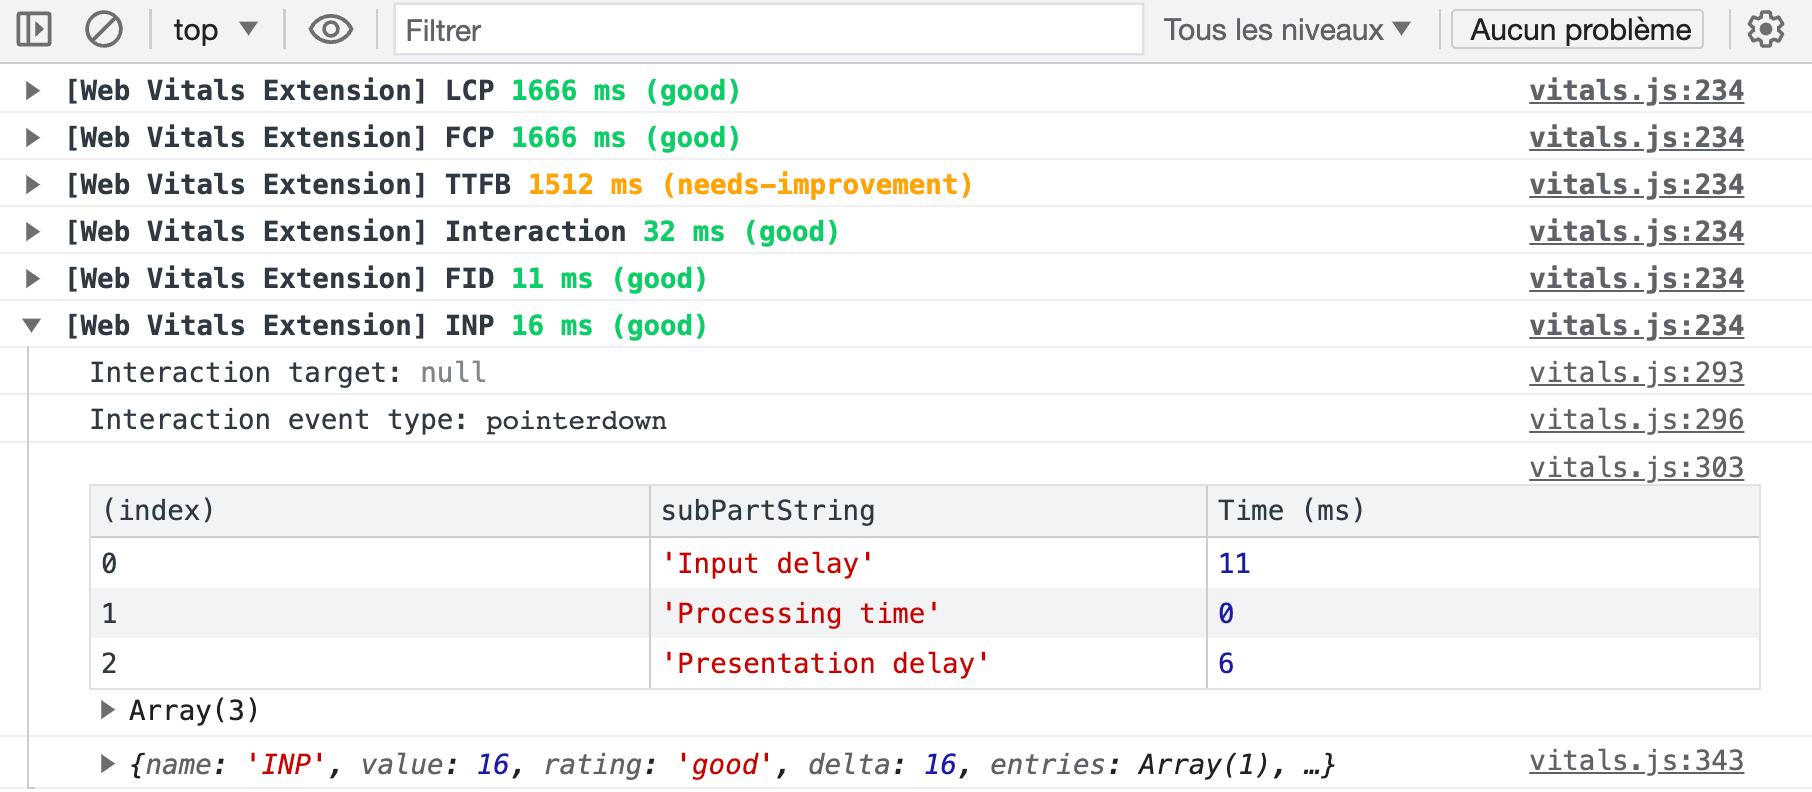
In the example above, we can see, for example, that the 16ms of INP are linked to an " input delay " (11 ms) but also to the rendering delay (6 ms). The threshold of 16 ms is actually a textbook case since on a classic computer monitor with a refresh rate of 60 Hz, a new image is generated every 16.66 ms (1000 ms / 60). Since the browser is unable to produce an image before the next refresh cycle, the INP is in fact rarely less than 16 milliseconds.
We are now able to access our users' performance data, which will allow us to move forward by trying to understand why some users are experiencing a high INP.
Is your site as fast as your visitors expect?

What impacts INP?
JavaScript Execution
As mentioned earlier, INP is a metric highly sensitive to the volume of JavaScript on a page. The metric is directly correlated with the number and especially the weight of the .js files called: not only do they consume bandwidth during download, but a heavy script consumes significant CPU and RAM resources to execute. (remember the correlation between the INP metric and the amount of available RAM).
This is why INP is also strongly correlated with the following metrics:
- Long Tasks: tasks that saturate CPU resource consumption for more than 50 milliseconds.
- Blocking Time: the script execution window that effectively penalizes interactivity. If a long task lasts 87 milliseconds, the Blocking Time will be 37 ms (87 – 50 ms).
- Long Animation Frames (LoAF): this is a new API intended to eventually replace Long Tasks, much like INP replaced FID. It offers an even more precise level of understanding of reactivity issues that can impact animations.
Third-party JavaScript, which generally weighs several tens of kilobytes, particularly impacts these metrics. If we had to rank the most impactful families, in a necessarily somewhat arbitrary way, it might look like this:
- A/B Tests, which by nature modify page content early in the rendering phase.
- Ad tags like Google Ads, Taboola, and ad network scripts performing real-time bidding to increase revenue.
- Behavioral analytics tools like Heatmap, Hotjar, and Mouseflow.
- Chatbots, especially AI-based conversational tools, often developed with questionable technical expertise.
- Embedded videos, particularly YouTube but also Vimeo.
- Social media embeds which, not only rely on JavaScript tags, but also load iframes that in turn call multiple scripts and resources.
These tools are often used together and possibly called via a Tag Manager which is also costly, they drastically increase INP, penalizing User Experience and reducing your efforts to pass Core Web Vitals. But third-party scripts are not the only ones to blame. A handful of other tool families regularly integrated into themes or technical stacks can also tank INP:
- Browser feature detection libraries like Modernizr;
- Date manipulation tools like Moment.js;
- Certain poorly developed polyfills;
- ... And all JavaScript frameworks, from the traditional jQuery to the very modern React and Vue.
Finally, it should be noted that certain features based on asynchronous requests (Ajax) can easily exceed the critical threshold of 500 ms. Because between a user clicking a vote button (for example) and the updated vote count appearing on the screen, the browser has exchanged data with the server, which itself performed a database query... And this rarely takes less than half a second.
Browser rendering
INP measures display latencies following user interactions. As we saw earlier, this is around 16 ms when everything goes well, with a large part related to the rendering phase steps. Each of these steps consumes CPU resources:
- Style: process of identifying which CSS selectors match which parts of the DOM (e.g.,
.body-footertargets the site's footer...). - Layout: set of geometric calculations to position elements on a 2D plane, both absolutely within the page body and relative to each other.
- Paint: process of filling in the elements present on the screen: text, colors, images, borders, shadows... The browser also groups elements into "layers" at this time.
- Compositing: displaying the different "layers" according to their visual depth relative to each other. This particularly concerns elements positioned absolutely with z-indexes.

However, in some cases, this rendering phase can be longer even without JavaScript being involved in the process. This scenario, much more common than we would like, is linked to the very design of websites, and particularly to the following aspects:
- HTML code of pages: a complex DOM structure with numerous nodes and multiple successive nesting increases CPU resource consumption, and therefore the time required for layout calculations.
- Suboptimal CSS: poorly implemented styles can generate multiple repaints and reflows upon interaction. The invalidation and recalculation processes implemented by the browser then block rendering and cause INP to skyrocket.
This suboptimal rendering issue is detrimental during the initial rendering phase, of course, but also afterwards. When a user interacts with a page and an element is modified within it, the browser will perform costly calculations to estimate if other elements on the page also need to change. It will thus go up the DOM tree to the root element, i.e., the <html> tag.
How to improve INP?
Three levers cover almost all cases: reduce the JavaScript work executed during interaction, break down long tasks to yield control to the browser, and defer everything that doesn't need to run immediately. INP is fixed by freeing up the main thread, never by optimizing images.
| Cause | Typical symptom | Fix |
|---|---|---|
| Long tasks during loading | Interactions ignored in the first few seconds | Break down tasks, defer non-critical JavaScript |
| Third-party scripts | Degradation on all pages | Defer, load on interaction, remove duplicates |
| Heavy event handlers | A specific interaction always slow | Lighten processing, defer off the critical path |
| Blocking rendering after interaction | Visible reaction very delayed | Update the interface before calculations |
| DOM too large | General slowness on mobile | Reduce the number of nodes, virtualize lists |
This grid serves as a starting point for diagnosis. The symptom column is the most useful: it allows you to trace back to the probable cause without instrumenting the code, based on what your users report or what field data shows. An interaction that is always slow and a generalized slowness do not call for the same fixes.
Based on these findings, we know that we need to work on optimizing JavaScript and rendering. But what does that mean concretely? That's what we're going to look at together through examples that are unfortunately very common.
Optimize your JavaScript code
Reduce the volume of JavaScript
The first step, as logical as it is effective, is to reduce the amount of JavaScript called on pages. I'm not making this up: it's an official recommendation from the web performance gurus working within Google's teams. You need to use common sense here and remove anything that isn't strictly necessary, at the risk of sometimes having to arbitrate between what's essential and what's a "nice to have".
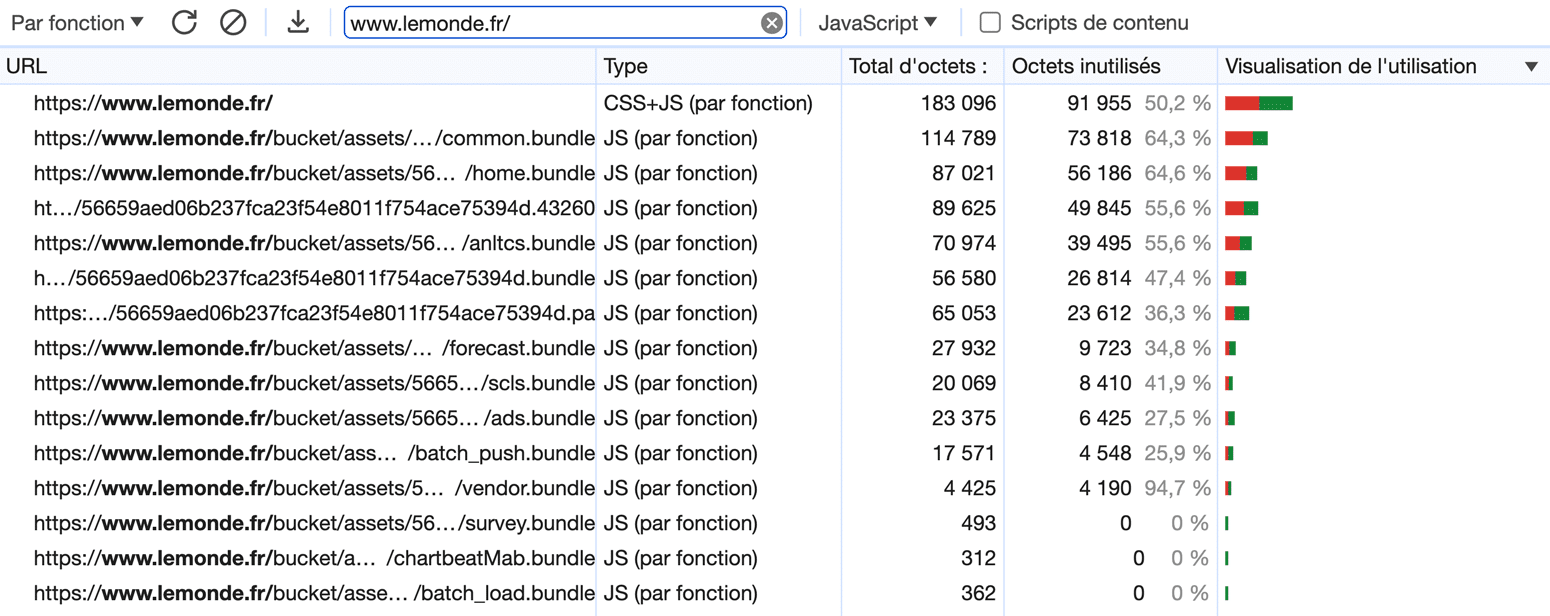
Every kilobyte of JavaScript less potentially translates into an improvement in INP with, as always, an advantage on the Core Web Vitals side but also User Experience. The tool of choice to initiate this identification mission is the "Coverage" tab in the developer tools (screenshot above). It allows you to detect the usage percentage of each JavaScript file, both first-party and third-party.
This approach can be complex for developments relying on dependency managers like Composer or npm, which tend to inflate the JavaScript volume in a rather opaque way. In any case, the logic will be to use the most specific tools possible, or even custom developments, to ensure that the weight of the bundles is as low as possible.
Download and execute scripts asynchronously
The HTML attribute async, which is generally associated with script calls to improve performance, is a double-edged sword. On the one hand, it makes calls non-blocking for rendering, which positively impacts loading time metrics like FCP, LCP, and Speed Index. But on the other hand, it makes their execution chaotic because while their download is indeed asynchronous, their execution mechanically follows immediately.
Concretely, this means that scripts with the “async” type can block page rendering at any time to execute. Now, if you recall, browser rendering and JavaScript execution are the two most costly operations for the browser. Chaining phases of one and then the other constitutes a catastrophic scenario in which Long Tasks, TBT, and INP are directly impacted.
The solution to ensure asynchronous behavior without blocking rendering is the defer attribute. The latter is not only asynchronous for downloading but also ensures that scripts only execute once the HTML document has been fully parsed. However, be aware: the attribute can only be used with external calls via an HTML <script> tag. Calling Google Tag Manager with defer thus requires some reformatting:
<script src="https://www.googletagmanager.com/gtm.js?id=XXXXXX" defer fetchpriority="low"></script>
<script>
window.dataLayer = window.dataLayer || [];
window.dataLayer.push({'gtm.start':new Date().getTime(), event:'gtm.js'});
</script>
Split long functions
Long Tasks are a major factor in the increase of INP. This is notably what explains the strong correlation between the latter and TBT. Now, Long Tasks generally result from monolithic JavaScript functions: since the browser can only execute code with a single CPU execution thread, it quickly becomes saturated and slows down the entire page.
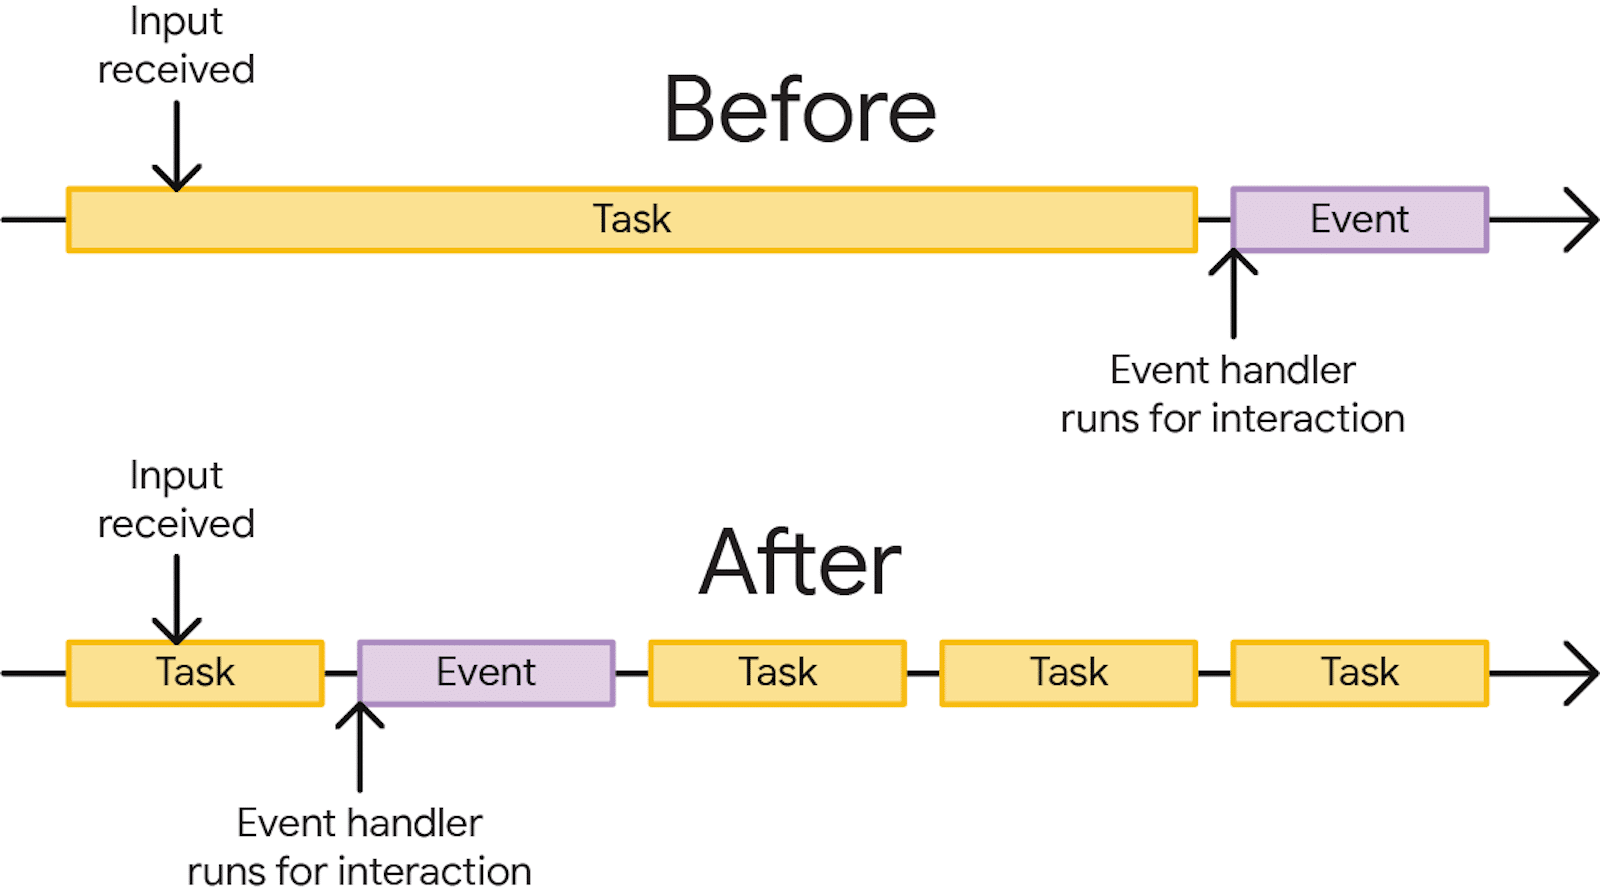
The solution is to break down the heaviest functions into shorter tasks to execute, ideally under 50 ms. These tasks must then be called in sequence, allowing the browser between each to handle a potential user interaction or perform screen rendering. Four tools can be used for this.
setTimeout(), a classic but misused function
Traditionally intended to delay the execution of a function after a defined period, setTimeout() also allows executing a task by decoupling it from the parent task. A value of zero is used for this, implying an “immediate” trigger:
setTimeout(() => this._loadDelayedScripts(), 0);However, the method is not the most efficient for this role. It notably does not allow for prioritization between the different chained sub-tasks.
requestAnimationFrame(), ideal for visual rendering
More modern and better suited to yielding constraints, requestAnimationFrame() is a JavaScript method designed to create fluid and efficient animations. Its support is now universal, but one can easily fall back to a classic setTimeout() if it is not supported by the browser.
The method that notably allows updating the animation before the next screen refresh is an option ideal for yielding functions intended to perform rendering. The latter will be automatically synchronized with the next browser refresh cycle, regardless of its display frequency. It can be used like this:
window.requestAnimationFrame(() => {
	document.querySelector('.share-buttons-toggler').remove();
});requestIdleCallback(), suitable for background tasks
The method is used to schedule tasks during browser idle periods, and thus de-prioritize certain operations over others. It is very effective for executing non-urgent tasks without compromising the page's performance and responsiveness.
requestIdleCallback() can thus be used to yield secondary functions while being sure not to block the main thread. It can be used in the following way with, as a complement, the optimal fallback behavior to a classic setTimeout():
if ('requestIdleCallback' in window) {
 	window.requestIdleCallback(() => this._loadDelayedScripts());
} else {
	setTimeout(() => this._loadDelayedScripts(), 0);
}scheduler.yield(), optimal but still poorly supported
This is a brand new native yielding API, currently only available in Google Chrome as an origin trial. The promise is more than attractive since scheduler.yield() aims to allow the execution of JavaScript functions without them blocking rendering or user interactions.
The method relies on generating a queue, into which it adds tasks to be executed later. Its main advantage over setTimeout() is its ability to maintain the notion of execution priority. Operations not performed during a cycle are notably reintegrated at the head of the execution queue, not at the end.
There is no doubt that in a few years, this will be the main solution for unclogging an overloaded main thread, and consequently improving the INP.
Reduce the number of Event Listeners
INP measures latencies related to user interactions. These can come from native features like activating a checkbox form field. But very often, they are defined in JavaScript via what are called Event Listeners. These are what allow a JavaScript function, called a "callback", to be triggered after a click, a screen touch, or a keyboard key press.
The higher the number of Event Listeners, especially if they target generic elements like <a> or <input> tags, the worse the INP will be. With every interaction with an element associated with an Event Listener, the browser will execute the JavaScript code associated with it. Even worse, the default execution behavior of these scripts is synchronous, which increases the risk of generating Long Tasks.
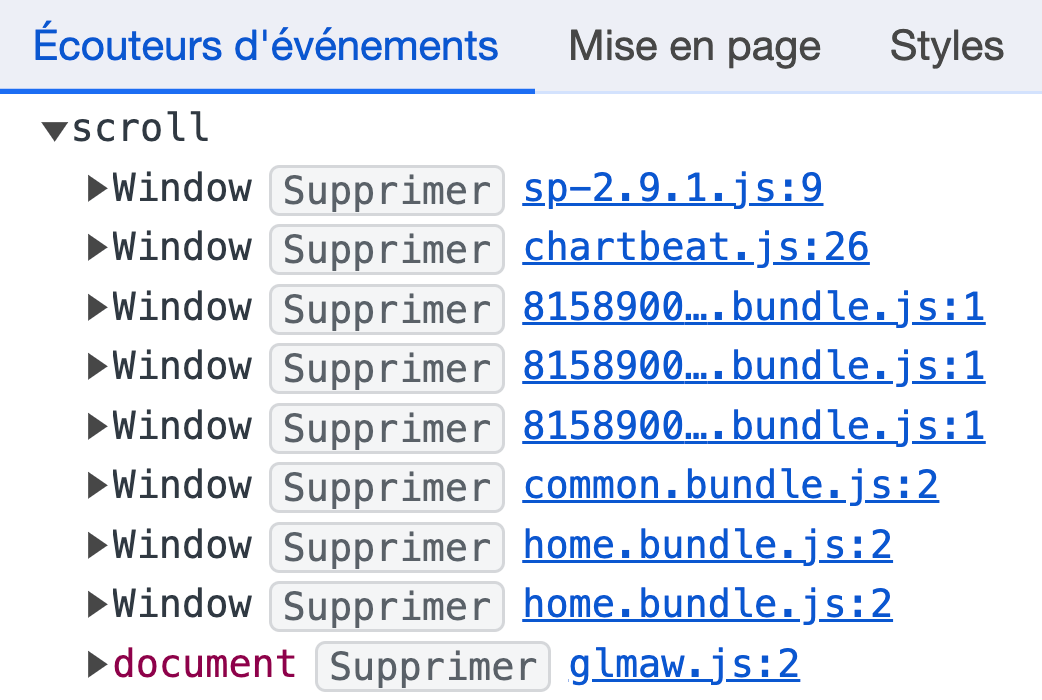
Fortunately, it is possible to modify this behavior to adopt passive execution. This is done using the "options" argument, in which a passive key is defined with the value true. Be careful, however: this implementation does not allow modifying the browser's default behavior via the JavaScript preventDefault() function. Here is a code example adopting this best practice:
[].forEach.call(document.body.querySelectorAll("a[target='_blank']"), function(el) {
    el.addEventListener(touchEvent, function(e) {
        alert("Vous quittez notre site !");
    }, {passive: true});
});
Provide feedback on interactions
We previously explained that certain Ajax-based features could have a major negative impact on INP. In this specific case, it is not only the script execution time that impacts the metric but also, and above all, the need to communicate with the server before displaying anything on the screen. From the user's perspective, this is still a waiting time, just like a classic Long Task.
The solution to avoid this type of delay is to systematically provide UI feedback on interactions. This is a fundamental best practice in terms of UX but unfortunately often ignored. Even before making your XHR request or executing your callback function, plan to inject an animated CSS loader or even a simple "Loading..." text.
The application areas for this recommendation are numerous:
- Add to cart button that checks product availability in the background before validation;
- Upvote or downvote button that increments a field in the database before displaying the updated count;
- "Load more..." button to handle dynamic pagination.
Defer execution
It often happens that, even when meticulously implementing the best practices developed previously, a page or an entire website continues to suffer from an excessively high INP. If all the JavaScript present is indeed used, there is one last resort: deferring execution. The idea is simple: rather than executing all the scripts during the initial load, only execute those strictly necessary for the site's operation at first.
Other scripts, especially third-party ones, are only downloaded and executed later. By splitting execution into two distinct windows, the risk of saturating available CPU resources is greatly reduced. Several behaviors are possible here:
- a simple delay via a
setTimeout(), usually 3 to 5 seconds after the JavaScript eventDOMContentLoaded; - triggering on user actions like clicks, scrolls, keyboard input, etc., by adding an Event Listener (my preferred solution);
- triggering on a scroll threshold within the page or when an area enters the active viewport, useful for example if a heavy script is only used in the footer.
Rather simple to implement, this feature is even intuitively available for WordPress CMS users thanks to extensions like WP Rocket and Perfmatters.
Implement facades
It sometimes happens that certain very heavy scripts are only used by a minority of visitors. This is typically the case for a Chatbot, whose tooltip proudly occupies the bottom right corner of the browser but with which only 0.5% of users interact. Or a video embed, which will mostly not be played. The question to ask here is: should we accept degrading the experience of all our visitors to meet the expectations of only 0.5% of them?
This is the problem that a "facade" addresses. Concretely, it consists of reproducing the interface elements that the user is accustomed to as faithfully as possible, such as a floating bubble for a Chatbot or a cover thumbnail with a play button for a video embed. The corresponding script is only downloaded and executed when the user interacts with the trigger element, completely transparently.
Ideal for both cases presented, this solution nevertheless requires more development. The HTML and CSS must be integrated to closely match the final result, while on the JavaScript side, an Event Listener must be associated with the triggers to load the script in the background when the time comes. Here is an example of a script used to load a Typeform form:
var typeform_loaded = false,
    typeform_load = function() {
      return new Promise(function(resolve, reject) {
        if(typeform_loaded === false) {
        const s = document.createElement('script');
        let r = false;
        s.src = "https://embed.typeform.com/next/embed.js";
        s.async = true;
        s.onerror = function(err) {
          reject(err, s);
        };
        s.onload = s.onreadystatechange = function() {
          if (!r && (!this.readyState || this.readyState == 'complete')) {
            r = true;
            typeform_loaded = true;
            resolve();
          }
        };
        const t = document.getElementsByTagName('script')[0];
        t.parentElement.insertBefore(s, t);
      }
      });
  };

 [].forEach.call(document.body.querySelectorAll(".load-typeform"), function(el) {
    el.addEventListener("mouseenter", typeform_load, {passive: true});
  });
Rely on a Service Worker or a Web Worker
When certain heavy tasks need to be executed via JavaScript, it is finally possible to opt for a different implementation. Although they address very different use cases, both Service Workers and Web Workers allow scripts to be executed asynchronously using a different processor thread than that of the pages.
One of the most ambitious tools in this area is Partytown. By ingeniously diverting certain browser mechanisms, it makes it possible to execute third-party scripts in a Web Worker with full support for native APIs. It is notably compatible with Google Tag Manager, Google Analytics, Facebook Pixel, and Hubspot, all known for their negative impact on Blocking Time and INP.
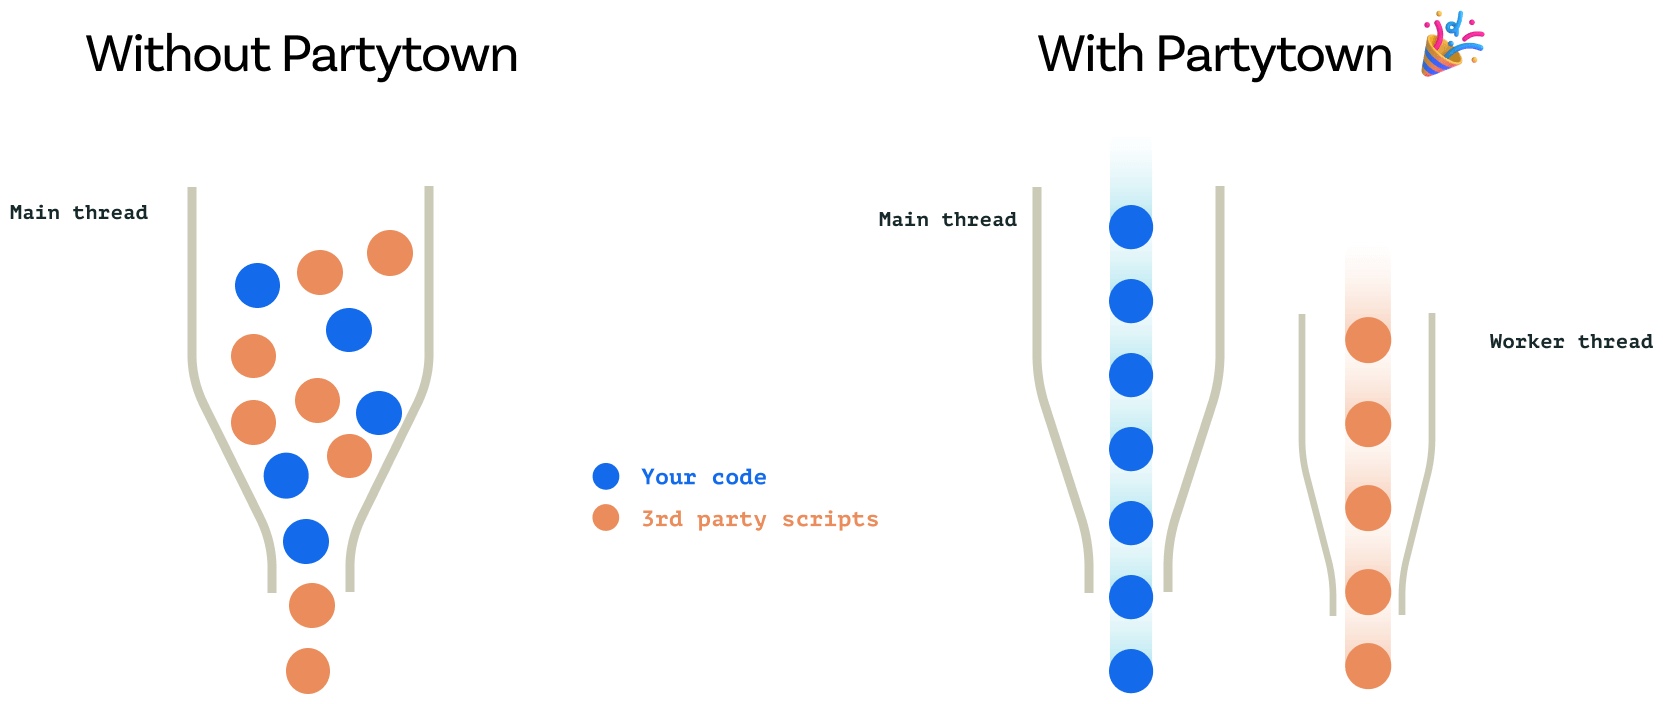
This results in much better interactivity of the pages themselves. However, be aware: Service Workers also have certain limitations, the most significant being an average latency of 300 milliseconds on initial load.
Avoid using methods like alert()
The JavaScript methods alert(), prompt(), and confirm() are a simple and effective way to display a message or ask for user confirmation. However, they execute synchronously, blocking the page's main execution thread. In practical terms, this means that interaction is considered "in progress" until the user clicks the close button.
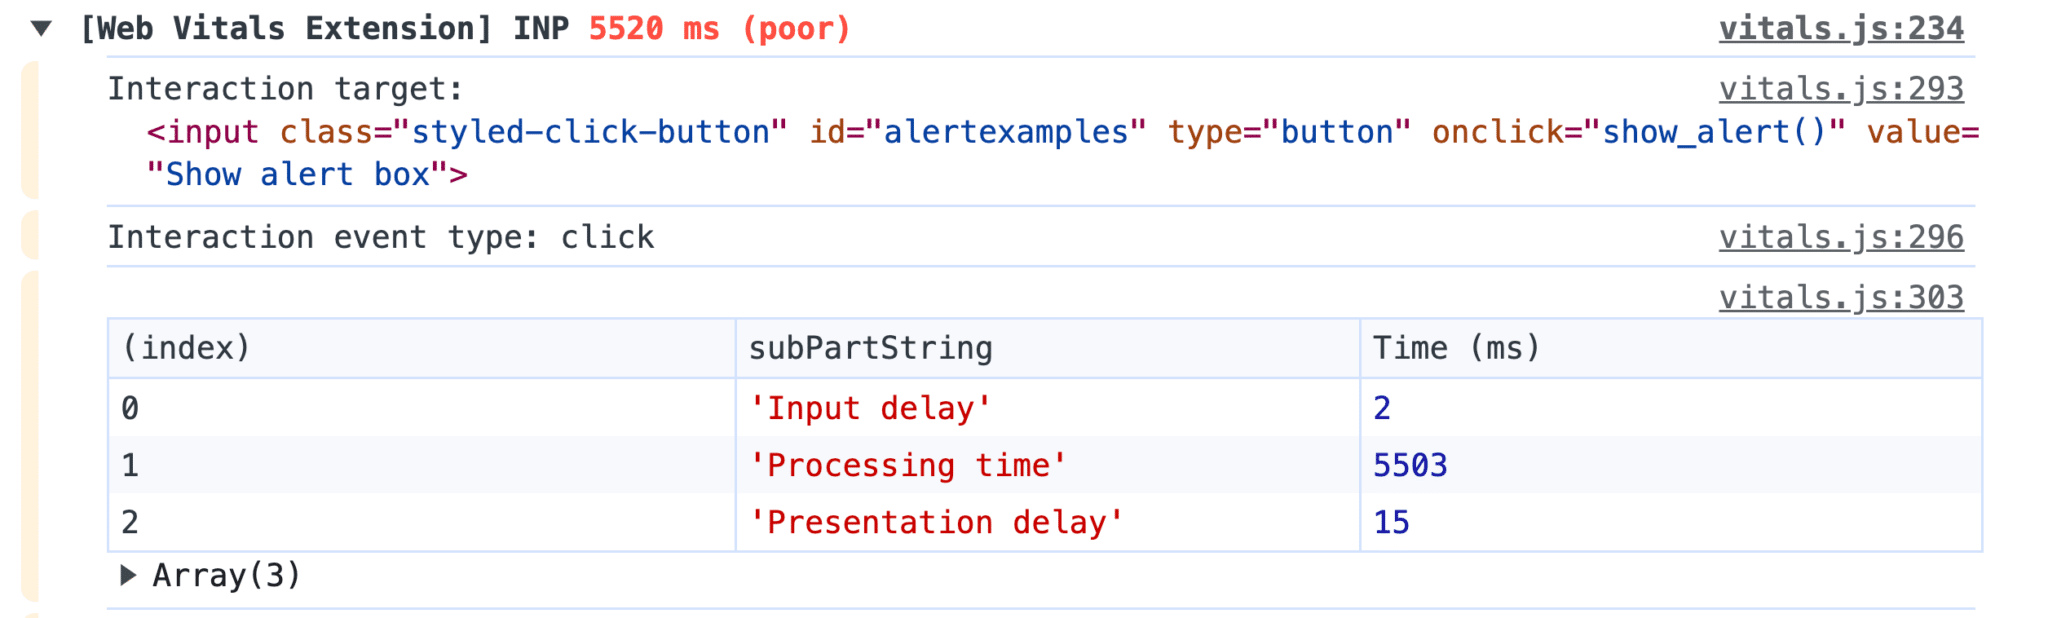
alert()-type window generates interactions considered very slow. Therefore, avoid using it on your site!Since this behavior can heavily penalize INP without causing user frustration, it's highly likely that a future update to the Core Web Vitals will change the game. But for now, it remains a crucial point of vigilance for managing INP.
Optimize your CSS
Limit the use of the universal selector
Fortunately, JavaScript isn't always the sole culprit when INP spikes. It can also be related to certain technical choices made by your integrator, a front-end developer, or the creator of your CMS, theme, or extension. One of the most common mistakes is overusing the universal CSS selector, represented by an asterisk (*).
When the browser's CSS parsing engine encounters a selector that relies partially or entirely on this selector, it has no choice but to test its relevance for all DOM nodes. This is a CPU-intensive operation, and therefore potentially generates latency that penalizes INP. So, avoid this selector like the plague by always favoring more specific selectors, ideally a class.
We will note in passing a very widely implemented exception on recent sites: the use of this selector to globally enable the border-box CSS rendering mode. This translates concretely into the presence of a CSS declaration of this type:
*,::after,::before {
 	box-sizing: inherit
}
Use performant animations
Talking about interactions without mentioning CSS animations would be a serious breach of web etiquette. Especially since, on the INP side, they can also play a significant role. This is the case in two distinct scenarios, but equally detrimental:
- continuous animations, such as an animated page background for example. They can generate high and constant resource consumption that will directly impact INP throughout user navigation;
- hover animations such as a zoom, a background color change, or the application of a
box-shadow. They can also negatively impact INP, but often less so due to their occasional activation.
To avoid negatively impacting performance, the first best practice is to exclusively use animations based on transform and opacity. If you encounter width, margin, or top within an @keyframes declaration, you have reason to worry: these are problematic "non-composite" animations. This will force the browser to go through the Layout, Paint, and Compositing phases presented earlier.
This is not an arbitrary decision but the consequence of an architectural choice by browsers: opacity and transform natively benefit from hardware acceleration, and are therefore processed by the GPU and not the CPU. Concretely, these animations will therefore not only be visually much smoother, but they will also not generate Long Tasks.
Relieve initial rendering
Regardless of the number of scripts and CSS animations on a page, an unoptimized DOM, i.e., a large and deep one, can negatively impact INP. Because during initial rendering as well as during user interactions, the rendering engine's calculations will be more costly, and therefore longer. When possible, especially when developing a custom site, it is therefore essential to ensure that a minimum DOM volume is generated.
However, such a goal is generally difficult to achieve, and the thresholds of 800 and 1400 nodes, considered the medium and high levels not to be exceeded, are quickly reached. Fortunately, this does not mean that all is lost. There are indeed CSS properties that allow the browser to be more efficient in rendering. One of the most powerful is "Lazy Rendering".
By assigning the value auto to the CSS property content-visibility, the browser will simply ignore the portion of the page concerned to only render it once it is close to the viewport. However, there is a major drawback: since the browser performs no rendering calculations, it is necessary to provide it with the final dimensions, otherwise, jerky scrolling may occur. This is easily done via the CSS property contain-intrinsic-height.
To make this clearer, here is an example of implementing Lazy Rendering on a footer. Footers are excellent candidates because they often contain more than 100 DOM nodes while being, by definition, visible quite late and by a minority of visitors.
.site-footer {
  	content-visibility: auto;
  	contain-intrinsic-height: 400px;
}

@media(min-width: 768px) {
  	.site-footer {
  	  	contain-intrinsic-height: 250px;
 	 }
}
Relieve rendering on interactions
While Lazy Rendering is relevant for improving initial load rendering times, and thus mechanically the INP, it does not help at all in the rest of the browsing sessions. To do this, there is a second native feature called "CSS containment". The latter allows limiting browser recalculations when an interface element changes: scrolling a slider, opening a table of contents, or simply changing a background color.
Implementing CSS containment influences how the browser traverses the DOM tree during a visual modification, as mentioned earlier. In concrete terms, it consists of defining, via CSS selectors, a kind of watertight barrier that will prevent the browser from going any further up. With this information, it will no longer try to determine if a modification within the container can impact its parents.
Since a good example is better than long explanations, here is a code snippet that allows you to isolate the sections in the content area of a page. It should be noted that for maximum impact, the CSS property contain must have the value content, but often, for compatibility reasons, we are forced to use the value layout style, which is less complete and therefore less effective.
#main-area > section {
	contain: content;
}
Reduce interactions on "dead" areas
One last CSS tool can help better control certain interaction-related behaviors, thus impacting how the INP is calculated. This is the pointer-events property which, when associated with the value none, can make a DOM area non-interactive. This is a tool to be handled with care, as misused, it can penalize the User Experience.
Specifically, deploying pointer-events: none; on a div will systematically generate very short interactions (around 16 ms), while making it impossible to trigger any action in JavaScript or CSS. There are few scenarios where such an implementation can truly add value.
What to do if the INP remains poor after optimization?
Revisit the diagnosis from the field rather than the code: identify which interaction, on which page, and on which type of device produces the worst values. A degraded INP almost always focuses on a specific interaction, often a filter, a search, or the opening of a panel, rarely on the entire site.
If the INP remains problematic despite implementing the recommendations detailed previously, this should lead you to deeply reconsider technical choices and the front-end stack. This involves re-evaluating not only the frameworks and tools used but also the overall architecture of the site.
To be completely explicit, improving the INP may require a complete redesign of a site. Such a decision should not be taken lightly, but it may prove essential to meet modern web performance expectations. It is crucial to select technologies and tools that not only meet current needs but are also capable of ensuring the responsiveness required by the INP.
The challenge is particularly tough for certain JavaScript frameworks of the SPA type, even though most have made significant leaps in this area as part of their latest updates.
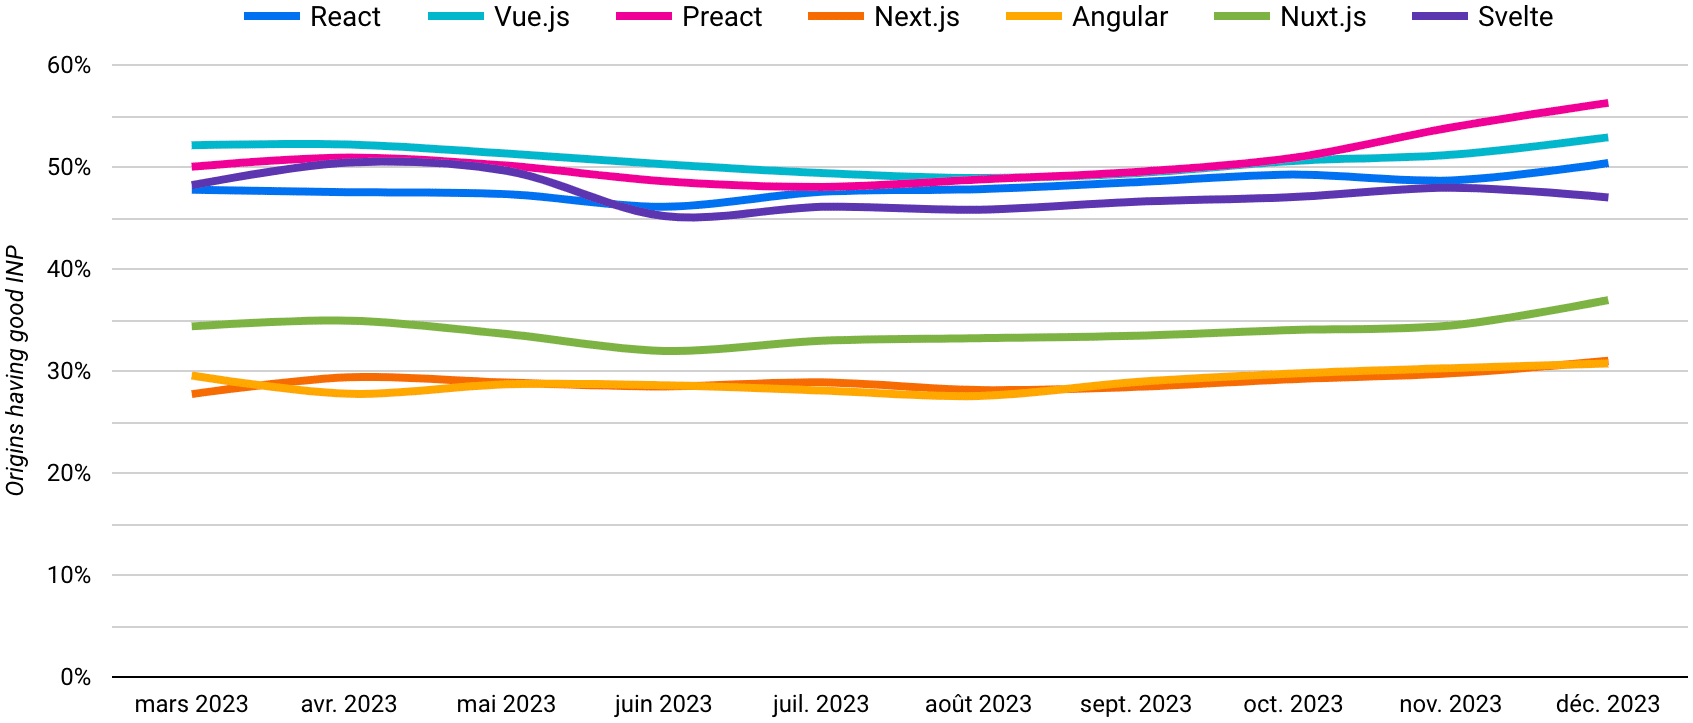
Historically, Core Web Vitals have focused on metrics that are potentially optimizable regardless of the environment, such as LCP and CLS. This allowed site publishers to adapt to these new constraints and deploy a continuous improvement approach. The INP, on the other hand, marks a turning point, potentially leading to a break in established practices.
This is a demanding metric, reflecting the evolution of user expectations for ever more interactive and responsive web experiences. Mastering INP is therefore not only an indicator of technical performance but also a sign of adaptation to current and future web trends.
What web performance awaits
I hope this journey through the intricacies of INP has satisfied your curiosity and, perhaps, sparked your interest in the discipline. What should be retained is that at the heart of Google's approach lies a clear mission: to measure as accurately as possible what the user truly feels when browsing a web page. Imagine these metrics as barometers that attempt to capture as faithfully as possible our comfort and ease during our online explorations.
What should also be retained is that making our users' navigation more pleasant is not just a nice initiative. It is also an excellent lever for business and reputation for a site. Whether we sell products online, offer advertising content, or anything else, ensuring that the visitor navigates with ease and pleasure proves to be a strategic, judicious, and always beneficial choice.
For the skeptics as well as for those who swear only by Core Web Vitals, let's recall the real place of web performance: one of the many factors among the hundreds that come into play in Google's unfathomable ranking algorithm. The important thing to keep in mind is that it allows quality sites to be distinguished from a multitude, the latter becoming ever larger and more qualitative with the increasing use of artificial intelligence and tools like ChatGPT. Webperf acts like a lighthouse, guiding users through the storm towards content that is truly worth exploring.
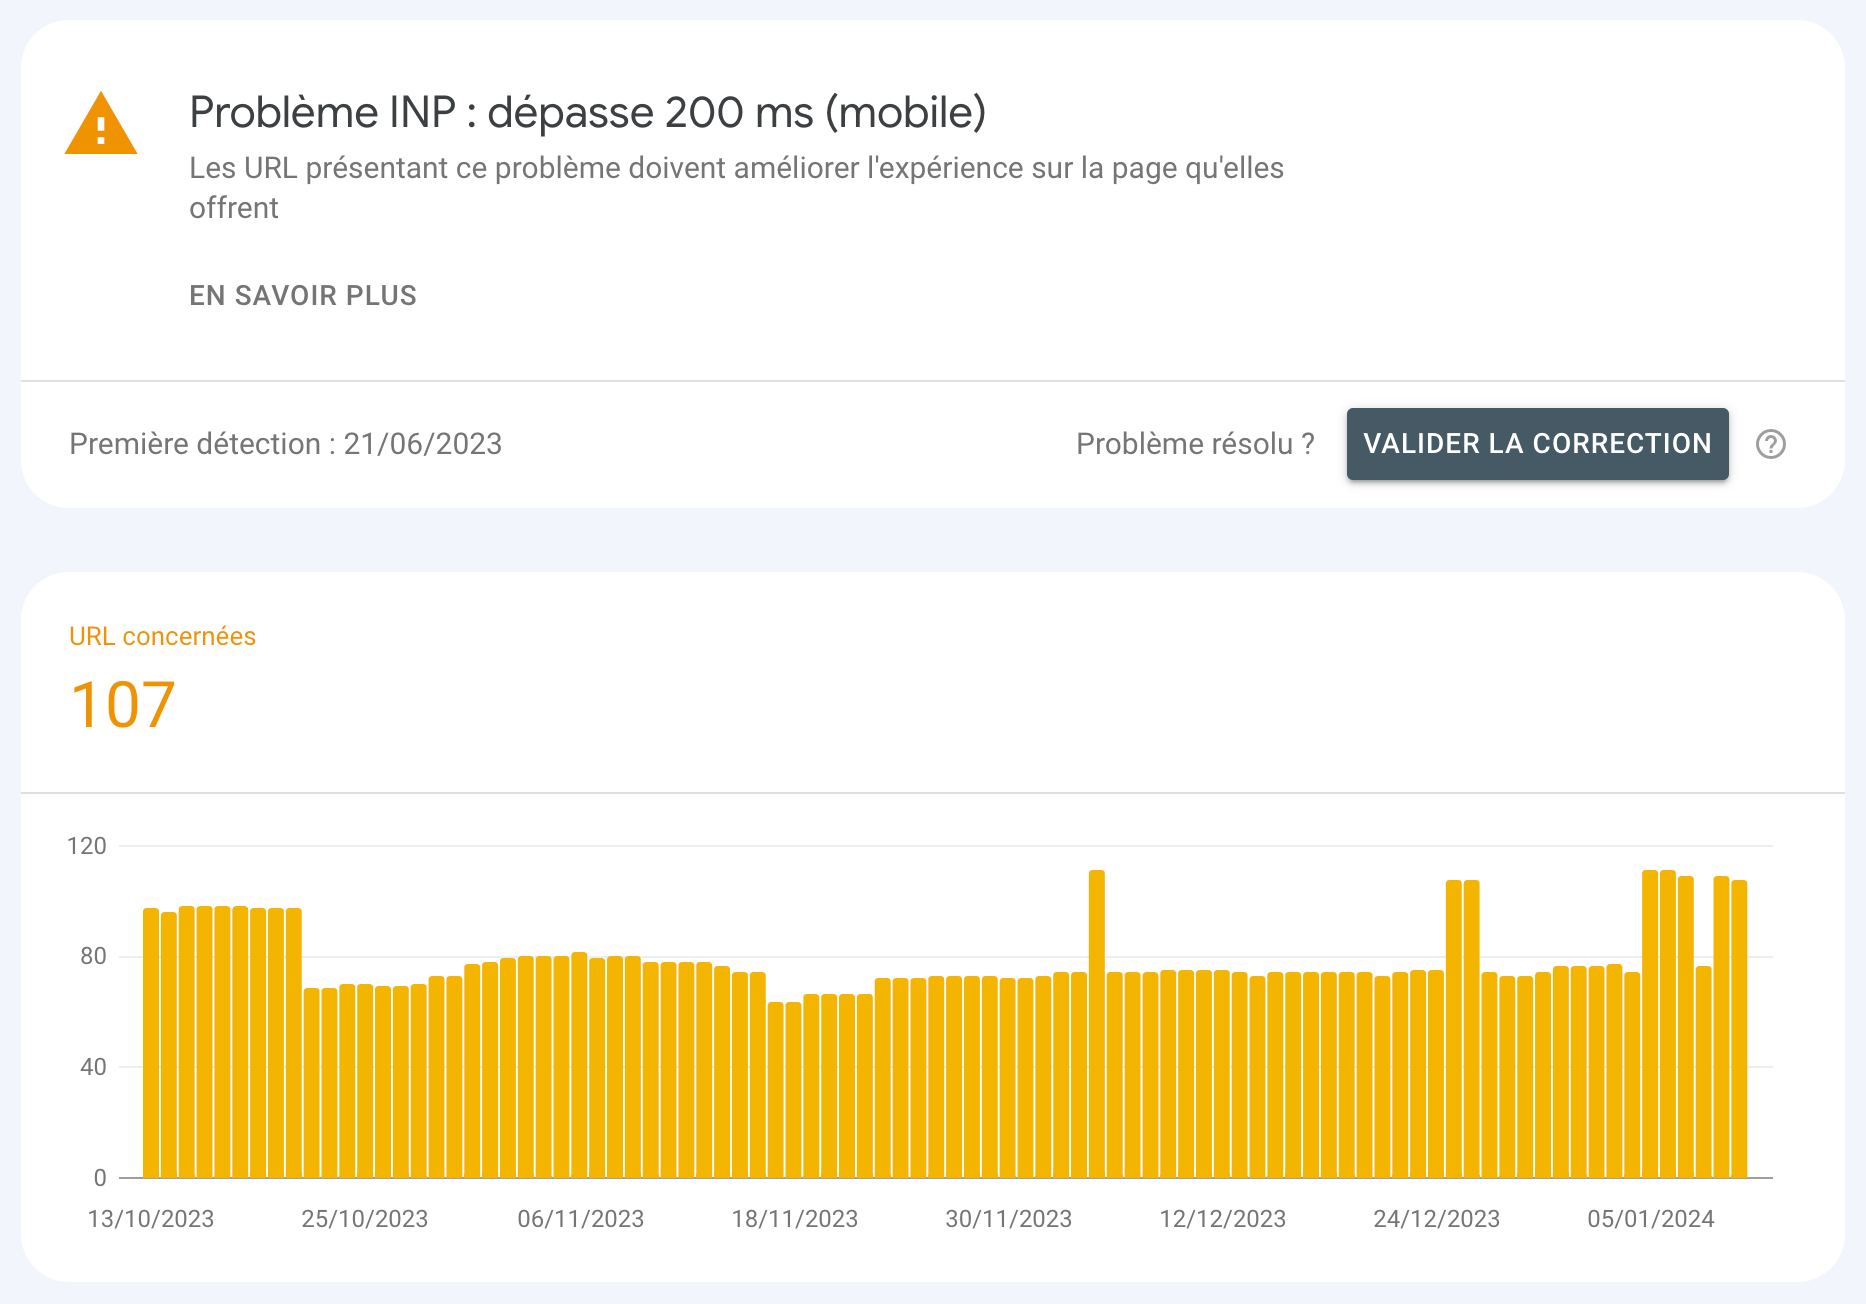
Now that INP is integrated into Google's Core Web Vitals, the hardest part remains to come for many. Because while some have already had the opportunity to adjust, improve, and refine the performance of their web pages by taking advantage of the Experimental period, others are still very far from reaching 200 milliseconds.
Faced with this challenge, you can choose to leverage the previously detailed paths, or entrust this project to experts like Agence Web Performance. We focus not only on INP, but on all factors influencing performance and user experience. Our rigorous methodology and advanced tools ensure that your website is not only compliant, but excels in all aspects of web performance.