
Before a single pixel appears, before the slightest image downloads, before the browser even knows what the page will look like, it waits for one thing: the first byte of the server's response. The time elapsed until that moment has a name, TTFB (Time To First Byte), and it determines everything that follows. A page cannot be fast if its first byte is slow: every millisecond of TTFB is fully reflected in all subsequent metrics, from the first render to LCP.
TTFB is, however, the most overlooked optimization. It's not part of the Core Web Vitals, it's not visible in a screenshot, and it happens in layers (network, server, database) less visible than the front-end. It's also a more subtle metric than it appears: depending on the tool measuring it and the definition it uses, two TTFB figures may not be talking about the same thing, and comparing them without caution leads to bad decisions.
After our guides on LCP, CLS, and INP, this new article in our series on metrics breaks down Time To First Byte: what it measures exactly, how to evaluate it correctly, what degrades it on the network and server side, and the levers to bring it back below the recommended thresholds.
What is TTFB?
TTFB, or Time To First Byte, is the time elapsed between the start of navigation and the arrival of the first byte of the HTML response. A good TTFB is less than or equal to 800 milliseconds at the 75th percentile of visits, and bad above 1.8 seconds.
The reference definition, provided by web.dev, is as follows: TTFB is the time elapsed between the start of navigation and the arrival of the first byte of the HTML response. This delay is not a monolithic block: it aggregates a whole series of steps, each of which can become the weak link. Potential redirects, DNS resolution, TCP connection establishment, TLS negotiation, request sending, then server processing time and the response's return trip: TTFB is the sum of everything preceding the first byte, and optimizing it starts with identifying which of these steps weighs the most.
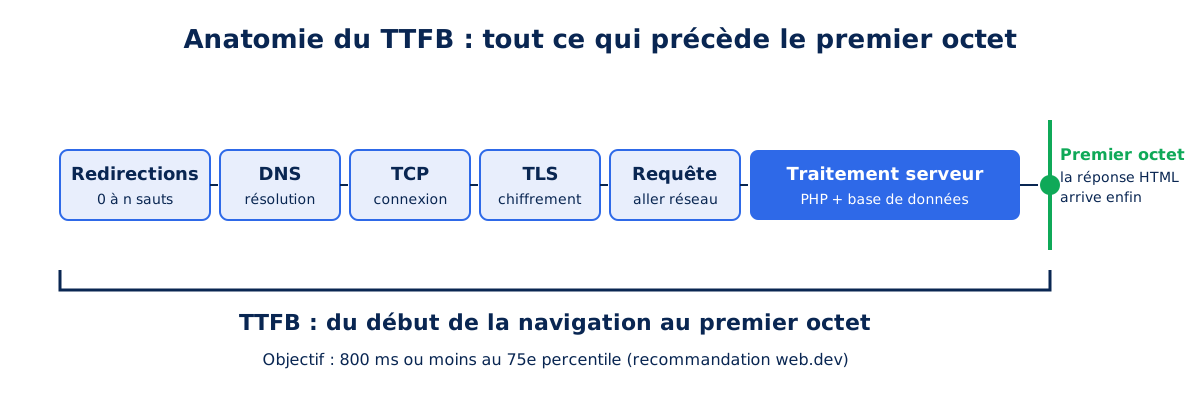
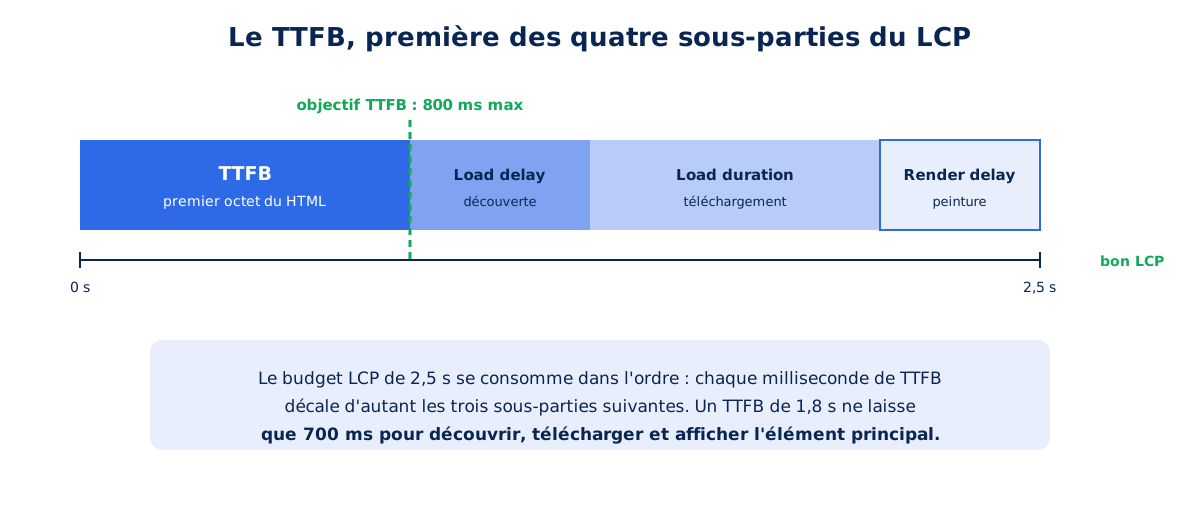
Regarding thresholds, web.dev recommends aiming for a TTFB of 800 ms or less at the 75th percentile of visits, and considers any value over 1.8 seconds to be poor. The logic behind these numbers is arithmetic: the good LCP threshold is set at 2.5 seconds by the official documentation, and TTFB consumes the first portion of that. A TTFB of 1.8 seconds leaves only 700 ms to download and display the main page element: in other words, the game is lost before it even begins. This is precisely what the breakdown of LCP into sub-parts proposed by web.dev shows, with TTFB being the first of the four segments.
One metric, multiple definitions
A warning is in order before comparing numbers. As detailed by Robin Marx, web performance architect at Akamai, in his article in the Web Performance Calendar 2025, the term TTFB covers several competing definitions depending on the tools: some measure from the start of navigation, including redirects, others from the sending of the request over an already established connection, and still others exclude DNS or TLS. A TTFB measured by curl on a new connection, the one displayed by DevTools, and the one reported by Chrome's field data do not measure the exact same interval.
Recent mechanisms like speculative preloading, which we explored in our article on Speculation Rules and prerendering, further obscure the interpretation: a prerendered page shows an almost zero TTFB that no longer says anything about the server. The rule of thumb is simple: always compare measurements from the same tool, under the same conditions, and document what is being measured.
What is a good TTFB?
A good TTFB is 800 milliseconds or less, to be improved between 800 ms and 1.8 seconds, and poor beyond that. These thresholds are assessed at the 75th percentile of visits, meaning for three out of four visitors, including those on modest devices and slow connections.
| Value at the 75th percentile | Verdict | Impact on LCP |
|---|---|---|
| ≤ 800 ms | Good | Comfortable budget for the other 3 sub-parts |
| 800 ms to 1.8 s | To improve | Constrained budget, LCP difficult to achieve |
| > 1.8 s | Poor | Good LCP out of reach |
The third column explains why these thresholds matter. With the good LCP threshold set at 2.5 seconds, a TTFB of 1.8 seconds leaves only 700 ms to discover, download, and display the main element. The game is then lost before it has even begun, regardless of the care taken with the front-end.
A useful benchmark for positioning your site: the Lighthouse audit titled reduce initial server response time triggers precisely on this criterion. If it appears in your report, your TTFB exceeds the threshold, and it is the first point to address before any image or script optimization.
How to measure TTFB?
Measure TTFB in two places: in the Network tab of the developer tools or in JavaScript with the PerformanceNavigationTiming API for diagnosis, and in Chrome's field data to know the actual experienced value. The lab explains, the field arbitrates, and the two never give the same figure.
The most direct measurement is in the DevTools Network tab: the first line of the waterfall, that of the HTML document, details in its Timing tab the server response waiting time, broken down into phases (DNS, connection, TLS, waiting). In JavaScript, the PerformanceNavigationTiming API exposes the same timestamps, and TTFB corresponds to the responseStart attribute, measured from the start of navigation. It is this definition, including redirects and connection, that is used by tools in the Chrome ecosystem, and it is what we use in the rest of this article:
const [nav] = performance.getEntriesByType('navigation');
console.log('TTFB :', nav.responseStart, 'ms');

// Décomposition des étapes qui le composent
console.log('Redirections :', nav.redirectEnd - nav.redirectStart, 'ms');
console.log('DNS :', nav.domainLookupEnd - nav.domainLookupStart, 'ms');
console.log('TCP + TLS :', nav.connectEnd - nav.connectStart, 'ms');
console.log('Requête + serveur :', nav.responseStart - nav.requestStart, 'ms');
These lab measurements have a limitation: they describe your connection, from your machine, at a given moment. Your visitors, however, connect from other networks, other continents, other devices. Field data from the Chrome UX Report aggregates the TTFB actually experienced by Chrome users on your site, at the 75th percentile, and constitutes the only reliable basis for judging the real situation.
The distinction between these two families of tools is a subject in itself, which we have covered in our comparison PageSpeed Insights vs. Lighthouse: remember that lab TTFB is used for diagnosis, and field TTFB is used to prioritize and observe progress.
The trap of averages and bimodal distributions
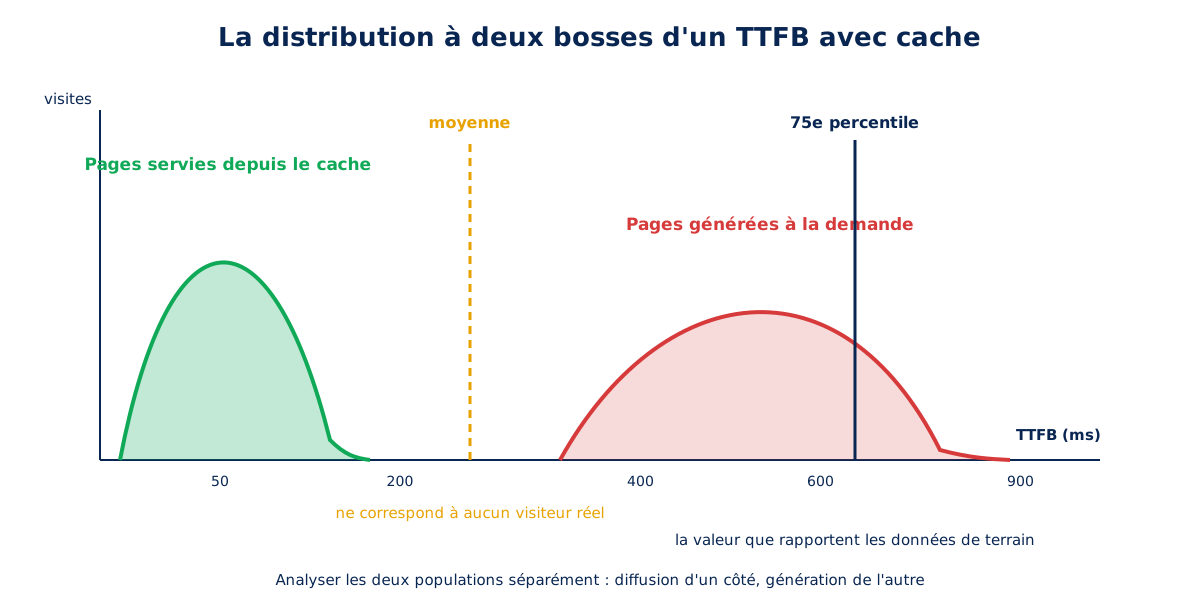
One last measurement reflex makes all the difference: never reason in averages. A site's TTFB typically forms a bimodal distribution: a population of requests served from the cache, in tens of milliseconds, and a population of on-demand generated requests, ten to fifty times slower. The average of the two falls in between, which corresponds to no one's experience, and masks both a poor hit rate and abnormally slow generation.
This is why field data is expressed at the 75th percentile: this value guarantees that three out of four visitors have an experience at least as good as the displayed figure. In practice, the best approach is to examine the two populations separately: the TTFB of cached pages measures the health of the delivery infrastructure, while that of uncached pages measures the health of generation. Confusing them means optimizing blindly.
What slows down TTFB on the network side?
Five steps consume time even before your server receives the request: redirects, DNS resolution, TCP handshake, TLS negotiation, and HTML compression. Each step adds the visitor's latency once, which quickly adds up on a mobile network.
A portion of the TTFB is consumed even before your server receives the request. At this stage, everything is measured in round trips: each step adds the visitor's latency once to the waiting time, and this latency quickly adds up to tens of milliseconds on a mobile network. Five areas make up this chapter: redirects, connection establishment, protocol, geographic distance, and compression, to which is added a separate mechanism, Early Hints, which does not reduce waiting time but makes it more profitable.
Redirects, latency paid twice
The first, often overlooked, item is redirection: each hop (from HTTP to HTTPS, from the apex to www, from an old URL to a new one) costs a full network round trip, and redirect chains add them up. The MDN documentation reminds us that they accumulate silently over the course of migrations: an external link in HTTP to an old domain can go through three redirects before reaching the final page, which is three times the visitor's latency added to the TTFB before any useful work is done.
The redirection effort is carried out in two stages. Inventory first: Search Console crawl reports and a site crawl reveal existing chains, and the curl -IL command allows you to follow the path of a given URL step by step. Reduction second: each retained redirection must lead directly to the final URL, in a single hop, including from historical domain variants. Internal site links should never go through a redirection: pointing directly to the canonical URL is a free gain, repeated on every navigation by every visitor.
A special case can be removed rather than optimized: the redirection from HTTP to HTTPS, present on almost all sites. The HSTS header, documented by MDN, instructs the browser to never again attempt the unencrypted version: from the second visit, this jump purely and simply disappears from the path. Registration on the HSTS preload list embedded in browsers extends protection to the very first visit: the jump from HTTP to HTTPS is never paid again.
DNS, TCP, TLS: the entry ticket for every connection
Before the first useful byte, a new connection goes through three stages: DNS resolution, which translates the domain name into an IP address, the TCP handshake, which establishes the channel, and the TLS negotiation, which encrypts it. Each costs one or more round trips, and their total weight depends directly on the latency between the visitor and the server. On a fiber connection with 5 ms latency, the cost is painless; on a mobile in a mid-range area, it can represent several hundred milliseconds of TTFB on its own.
Each stage has its lever, starting with DNS, which is mistakenly thought to be uniform: resolution depends on the provider hosting your zone, and not all offer the same level of performance. Continuous measurements by DNSPerf (secondary source) show significant differences in response times between providers in Europe, with Cloudflare regularly topping the rankings. Changing zone providers is a painless and often free operation, and reasonable TTLs also prevent repeated resolutions.
On the TLS side, the protocol version matters: TLS 1.3, specified by RFC 8446, reduces negotiation to a single round trip where TLS 1.2 required two, and its session resumption further shortens subsequent connections. For critical third-party domains, the rel="preconnect" hint finally allows this entry ticket to be paid in advance, while the browser is still busy elsewhere.
HTTP/3 and QUIC: merged handshakes
The most radical overhaul of this entry ticket comes from the protocol itself. HTTP/3, standardized by RFC 9114, abandons TCP in favor of QUIC, a transport built on UDP and specified by RFC 9000, which merges channel establishment and its encryption into a single handshake. QUIC even allows, when reconnecting to a known server, data to be sent from the first packet, and keeps the connection alive when the device changes networks, from Wi-Fi to 4G, without renegotiating everything.
Good news: activation generally requires no work. CDNs and recent web servers offer it as a setting, and the browser discovers the protocol's availability via the Alt-Svc header before switching for subsequent visits. Control is just as simple: availability is checked in the Protocol column of DevTools, where requests served in HTTP/3 appear as h3. A site still entirely in h2, or even http/1.1, leaves round trips on the table with each new connection.
Discovery via Alt-Svc has a limit, however: it only benefits subsequent visits, the very first connection still being established over the classic TCP and TLS stack. DNS SVCB and HTTPS records, standardized by RFC 9460, fill this gap: published in the domain's zone, they announce supported protocols in the DNS response itself. The browser thus knows, even before opening the connection, that it can speak QUIC: HTTP/3 is used from the very first connection, without prior fallback to h2. Most CDNs publish these records automatically for the zones they manage; on a manually administered zone, an HTTPS record with the parameter alpn="h3" is sufficient.
Geographic distance: the CDN lever
All previous round trips have a cost proportional to the distance: since physical latency is incompressible, shortening them involves bringing things closer. This is the geographic role of the CDN: placing an endpoint near each visitor, so that DNS, handshakes, and encryption are negotiated over a few tens of kilometers rather than across a continent. For international traffic, bringing the connection endpoint closer remains the most effective network lever, far ahead of any fine-tuning of the protocol.
The benefit extends far beyond static files: even a dynamic, non-cacheable page benefits from a CDN, because the visitor's connection terminates at the edge, and the edge then communicates with your server over already established connections, kept warm between requests. The visitor pays for the short latency, the infrastructure pays for the long one.
This long latency, between the edge and the origin, is also optimized. Cloudflare Argo Smart Routing is a good example: rather than following the default Internet routing, the service routes requests to your server via the fastest and least congested paths on the Cloudflare network, continuously measured, as described in its official documentation. The gain is maximal for visitors furthest from the origin, precisely those whose TTFB suffers the most. The other benefits of these networks, including shared caching, are detailed in our analysis of the pros and cons of CDNs.
103 Early Hints: making incompressible waiting profitable
When the server genuinely needs time to generate the page, part of the waiting can be put to good use rather than being endured. The 103 Early Hints status code, described in the Chrome documentation, allows the server or CDN to send a preliminary response while the page is being generated, telling the browser which critical resources (stylesheet, font, main image) to prefetch without waiting for the HTML.
The measured TTFB doesn't change, but the time it represents ceases to be dead time: by the time the first byte arrives, some resources are already being downloaded. It's a secondary measure, to be considered once the fundamentals are in place, but it illustrates a useful idea: TTFB is reduced first, and what remains of it can still be made profitable.
In practice, the system requires a component capable of issuing the 103 before the origin has responded: it's most often the CDN that caches the hints and serves them on the next request, as described in the Cloudflare documentation. The gain mechanically increases with generation time: the longer your server takes to process, the wider the window to make profitable. A site with an already excellent TTFB will gain almost nothing from it; a slow dynamic site will gain a lot.
HTML compression, in the critical path
A final network factor is hidden where you wouldn't expect it: compression. On a dynamic page, HTML is compressed on the fly, with each request, and this compression time adds to the TTFB. This justifies choosing the algorithm based on the content type, a trade-off we detailed in our comparison of gzip, Brotli, or Zstandard: recent algorithms compress dynamic content faster at comparable ratios, and every millisecond of saved compression is one less millisecond of TTFB.
Why is my server-side TTFB high?
Four causes dominate: shared hosting with shared resources, an outdated PHP version or poorly sized OPcache, extensions working in the background, and a neglected database. The combination of these causes produces the majority of degraded TTFB that we identify in audits.
Once the request arrives, the clock keeps ticking while the server generates the response. On a CMS like WordPress or PrestaShop, this generation involves starting PHP, loading the core and extensions, executing the theme, and dozens of database queries.
The quality of hosting weighs heavily here: an overloaded shared server, where hundreds of sites share the same PHP processes and database, produces erratic response times that no application optimization can fix. The foundations matter just as much: a recent PHP version, a properly sized OPcache that avoids recompiling code on each request, and an adequate number of PHP workers for the traffic form the base without which other optimizations are just patches.
The choice of hosting type deserves to be made with full knowledge. Entry-level shared hosting optimizes site density per machine, not response time for each; the parameters that matter (PHP memory, OPcache settings, database configuration) are fixed and inaccessible. A VPS provides control but transfers responsibility: the settings described in this article are then up to you.
Managed hosting services, finally, deliver these settings already configured, with integrated server cache layers. There is no universal answer, but a simple criterion: the real-world TTFB, measured on your actual site, during your actual traffic hours. Hosting is judged by this performance, not by its price list or its promises.
Plugins that work behind your back
There is a cause of degraded TTFB that front-end audits never see: the background tasks of plugins. Three examples constantly come up in our diagnostics. The Redirection plugin logs all 404 errors and redirects by default for a week: on a busy site, this represents tens of thousands of database writes per day, each executed on the critical path of the visitor's request.
Broken Link Checker periodically recrawls all links on the site, consuming CPU and outgoing connections. Wordfence, finally, scans the file structure at regular intervals, with disk and memory pressure that directly competes with visitor requests.
None of these behaviors are a defect: they are default settings, almost always adjustable in the interface of each plugin. Reducing Redirection log retention, spacing link checks to once a month, enabling Wordfence’s limited resource scanning mode: these three settings cost nothing and remove a permanent background load.
The real danger is their accumulation: a site that simultaneously runs these three processes is constantly subjected to one of them, and its average TTFB suffers across all traffic. This is one of the primary causes of unexplained degraded TTFB on sites that are otherwise well-optimized on the surface: all the front-end work is done, but the server remains busy with its own tasks.
The database, a silent bottleneck
At the very bottom of the stack, the database sets the floor for generation time. The most determining parameter is the InnoDB buffer pool, the RAM area where MySQL and MariaDB store recently read data: the MariaDB documentation calls it the first setting to examine, as a value that is too low forces disk reads with every query.
Yet the default value, generally 128 MB, is rarely adjusted, even on servers with several gigabytes of memory: the database then rereads from disk data that should live in RAM, and every dynamic page pays the price. Added to this are the slow queries from poorly designed plugins, which a tool like Query Monitor allows you to attribute precisely to their responsible party, extension by extension, hook by hook.
Two other areas deserve examination on any aging WordPress installation. The first is the options table: each option marked as auto-loaded, a behavior documented by the add_option function reference, is read and deserialized on every page display. Plugins uninstalled without cleanup leave kilobytes, sometimes megabytes, of data loaded for nothing with every query.
The second is general database fragmentation: never-purged log tables, revisions accumulated by the thousands, missing indexes on extension tables. None of this is visible in an interface, and all of it adds up, query after query, to the generation time.
wp-cron and the peaks that return at a fixed hour
WordPress's task scheduler deserves special mention, as its default behavior is counterintuitive: scheduled tasks, described in the developer handbook, do not run at a fixed time but on a visitor's arrival. When a task is due, a real visitor's request triggers it: that visitor pays, in their own TTFB, the cost of the backup, newsletter sending, or cleanup that was in the queue.
On sites with sustained traffic or heavy tasks, the classic workaround is to disable this visitor-triggered execution and delegate execution to a true system cron, at regular intervals and outside of visitor paths:
// wp-config.php : ne plus déclencher les tâches à la visite
define( 'DISABLE_WP_CRON', true );

# crontab du serveur : exécution toutes les 5 minutes, hors trafic
*/5 * * * * curl -s https://www.exemple.fr/wp-cron.php?doing_wp_cron >/dev/null 2>&1
This simple shift doesn't reduce the amount of work, but it removes it from the critical path: background tasks run between visits, never during. On real-world TTFB graphs, the effect is immediately visible by the disappearance of the periodic spikes that were chopping up the distribution.
Is your site as fast as your visitors expect?

How does caching reduce TTFB?
By eliminating work rather than speeding it up. A page served from a page cache wakes neither PHP nor the database; served from a CDN's edge, it doesn't even reach your server. We go from hundreds of milliseconds to a few, which no other lever can achieve.
All the previous levers reduce the cost of the work the server performs. Caching, however, eliminates that work. This makes it, by far, the most powerful lever on TTFB: a page served from a page cache bypasses PHP and the database, a page served from a CDN's edge even bypasses the trip to your server. The orders of magnitude change category: we're no longer talking about shaving off tens of milliseconds, but about replacing hundreds of milliseconds of generation with a few milliseconds of reading.
Caching is not a single button, however: it's a stack of layers, each with its scope and rules. The browser caches static resources, the CDN shares responses among visitors, the page cache avoids generating anonymous pages, the object cache (Redis, Memcached, or APCu) stores SQL queries for pages that cannot be cached, OPcache stores compiled PHP code, and the buffer pool keeps hot data in memory.
Each layer protects the one below it, and a mature strategy makes them work together: HTTP headers drive the browser and CDN, exclusions preserve logged-in users, purging maintains freshness on publication. We have dedicated a comprehensive web caching guide to this stack, from the browser to the database, detailing the configuration of each tier; here’s the key takeaway: on most sites with degraded TTFB, the first question isn’t ‘why is the server slow?’, but ‘why isn’t this work being cached?’.
The site’s profile determines where to focus efforts. An editorial or showcase site, with massively anonymous traffic, gets most of its gains from page and edge caching: when properly configured, its baseline TTFB becomes that of its delivery infrastructure, plus that of its application.
An online store or member area, where each visitor carries a session, lives in the opposite situation: its sensitive pages bypass page caching, and object caching, OPcache, and the database decide the experienced TTFB. Both profiles, however, share a common pitfall: believing the cache is active because a plugin is installed. Only checking the served headers, page by page and cookie by cookie, reveals what is actually being cached.
Why is my TTFB high?
Break it down before concluding: if the gap between the end of TLS and the first byte dominates, the cause is server-side; if it’s the connection steps, the cause is network-related. Then, check if the measured page was cached or generated. An average TTFB mixing both is meaningless.
| Cause | Characteristic sign | Fix |
|---|---|---|
| Lack of page caching | High and stable TTFB on all pages | Enable page caching or a reverse proxy |
| Shared hosting | Erratic TTFB, peaks during peak hours | Switch to a dedicated server or VPS |
| Redirect chain | Significant delay before the request itself | Redirect in a single hop, enable HSTS |
| Geographic distance | Correct TTFB locally, poor abroad | Place a CDN in front of the site |
| Background tasks | Cyclical peaks at regular times | Move cron jobs out of the visitor path |
| Neglected database | Slowness only on uncached pages | Size the buffer pool, purge logs |
The middle column is the one that saves time. Each cause leaves a recognizable signature in the distribution of measurements: a stable, high TTFB doesn’t have the same origin as a sawtooth TTFB, and a gap between French and foreign visitors immediately points to distance rather than the server.
Faced with a degraded TTFB, the temptation is to pile on optimizations randomly. The rigorous approach consists of breaking down, then isolating. First step: distinguish the network from the server. A tool as simple as curl provides the complete breakdown from the command line:
curl -s -o /dev/null -w "DNS: %{time_namelookup}s
TCP: %{time_connect}s
TLS: %{time_appconnect}s
TTFB: %{time_starttransfer}s
Total: %{time_total}s
" https://www.exemple.fr/
If the gap between TLS and TTFB dominates, time is lost on the server side; if the first lines weigh heavily, the problem is network-related (slow DNS, lack of CDN, redirects). Second step: check what the cache is doing. The cf-cache-status header from a CDN, headers added by cache plugins, or a simple comparison between an anonymous request and a request with a session cookie immediately reveal whether the measured page was served from a cache or generated on demand: an average TTFB calculated by mixing the two is meaningless.
Third step: repeat the measurement. An isolated TTFB has no statistical value; measurements spaced over several hours reveal cyclical patterns, those regular peaks that betray a scheduled task, a backup, or a security scan, exactly the kind of cause a single measurement will never show.
The last step connects the symptom to its cause within the application itself: the Server-Timing header allows the server to expose its internal timings (database, rendering, cache) directly in DevTools, and Query Monitor does the same job within WordPress. At this point, the culprit usually has a name: an SQL query, a plugin, an external API call made during page generation.
Where to start to reduce your TTFB?
In this order: page cache for anonymous visitors, CDN and cache headers, execution foundations with PHP and the database, then parasitic loads and protocol settings. This ranking follows the gain divided by the risk of regression, and avoids polishing milliseconds before seconds.
Once the diagnosis is made, the order of work matters as much as the work itself. Our experience converges towards a stable hierarchy. The first task is always the page cache for anonymous visitors: it's what changes the order of magnitude, and any fine-tuning done before it will be measured in the noise. Next comes delivery: a CDN in front of the site, clean cache headers, and verification that the hit rate is actually there.
The third task concerns execution foundations: up-to-date PHP version, sized OPcache, database buffer pool adjusted to available RAM. The fourth tackles parasitic loads: plugin logs, security scans, scheduled tasks moved out of the visitor's path. The last, finally, is about finesse: compression adapted to dynamic content, Early Hints, protocol settings.
This hierarchy is not arbitrary: it ranks levers by expected gain divided by regression risk, and it avoids the classic pitfall of polishing milliseconds while hundreds of milliseconds wait.
A word on what this plan does not include: front-end optimizations. Minifying JavaScript, deferring scripts, or optimizing images has no effect on TTFB, which is entirely consumed before the first byte of HTML. The reverse is not true: a healthy TTFB makes every front-end optimization more visible, since the entire cascade starts earlier. This is the natural order of a performance project: the server first, rendering second.
What is the impact of TTFB on LCP?
TTFB is the first of the four sub-parts of LCP: as long as the HTML has not arrived, the browser does not know which resources to load. Reducing TTFB by 500 ms advances the entire cascade by 500 ms, and therefore FCP, LCP, and interactivity.
TTFB is never an end in itself: your visitors don't perceive bytes, they perceive a page loading. But its position at the head of the chain gives it a multiplying effect. HTML is the resource from which all others derive: as long as it has not arrived, the browser knows neither the styles, nor the scripts, nor the images to load. Reducing TTFB by 500 ms means advancing the start of the entire loading cascade by 500 ms, and therefore, mechanically, FCP, LCP, and interactivity. Few performance levers offer this property: a gain on TTFB propagates to all downstream loading metrics.
Your human visitors are not the only ones concerned. Indexing robots also experience the same first byte, and Google indicates in its crawl budget documentation that a site that responds quickly allows Googlebot to crawl more pages, while lengthening response times slow it down. On large sites, a degraded TTFB therefore costs double: a diminished user experience, and fading index freshness.
This is also what makes its diagnosis so profitable: the causes of a high TTFB (missing cache, undersized hosting, neglected database, background tasks) are precisely those that will end up degrading the rest of the site. If your field TTFB exceeds the recommended 800 ms, the entire chain deserves examination, from HTTP headers to the buffer pool. This is the core of our business of web performance optimization: tracing the chain back to the first byte, measuring each link, and returning to the server what belongs to the cache. Your LCP, and your visitors, will see the difference from the very first byte.