Since 2020, Google has developed a vast ecosystem of tools to analyze site performance from the perspective of Core Web Vitals. Some rely on real user data, others on on-demand tests, and the two best known, PageSpeed Insights and Lighthouse, are so often confused that audits are still read presenting lab data as a score assigned by Google to the site.
Lighthouse is an open-source audit engine, integrated into Chrome's developer tools, which loads a page under simulated conditions and produces a score and recommendations. PageSpeed Insights is an online service that runs this same engine on Google's servers, and adds field data from the Chrome User Experience Report. The difference can therefore be summed up in one sentence: one measures a simulation, the other adds reality to it, and only reality matters for SEO.
This article explains what separates field data from lab data, what the two tools share and what distinguishes them, how to read a Lighthouse score since the redesign of version 13 in October 2025, and which one to use depending on the question asked. Why can a site display 100 on Lighthouse and fail Core Web Vitals in Search Console?
What's the difference between field and lab data?
Field data is collected from your real visitors during their browsing, on their devices and connections; lab data comes from a replayed load under controlled conditions, a simulated Moto G4 on a mobile network for PageSpeed Insights. The former measures what happens, the latter explains why. Neither replaces the other.
What is field data?
Field data, or field data, is collected on your visitors' devices and connections, then aggregated at the 75th percentile over 28 rolling days. The only public source is the Chrome User Experience Report, CrUX, powered by Chrome users, and it is what Google uses to evaluate Core Web Vitals in Search Console. Its methodology specifies that for a user to contribute to it, four conditions must be met:
- usage statistics reporting enabled in Chrome;
- browsing history synced with their Google account;
- no sync passphrase set, which encrypts data end-to-end;
- using a supported platform, which excludes Chrome on iOS, Android WebViews, and other Chromium-based browsers like Edge.

Google does not publish the proportion of users who meet these criteria, and the absence of iOS introduces a known bias: iPhone owners, who are often better equipped, are not included, which pulls the numbers down. This data is also subject to high variability, depending on the location, connection, hardware, and extensions of each visitor. This is why we work at the 75th percentile, and with the three-segment distribution gauge, well, to improve, and poor:

What is lab data?
Lab data, or synthetic data, comes from a load triggered on demand on a simulated machine and network. It is reproducible, immediately available, and detailed down to the request and line of code. It says nothing about your real visitors, but it is the only way to diagnose, because it exposes the complete loading cascade.
Analysis can be launched from a user's browser, as Lighthouse does in DevTools, or from dedicated infrastructure, as PageSpeed Insights, WebPageTest, or GTmetrix do. In the latter case, the advantage is that the conditions remain identical from one test to another: the same processor, the same memory, the same simulated throughput and latency. This stability allows comparing the same site over time, or several sites with each other, with indicators that do not depend on the network's mood.
Unlike field data, the lab produces unique values, in milliseconds for FCP, LCP, Speed Index, and Total Blocking Time, and as an index for CLS, each associated with a green, orange, or red threshold. One metric is missing, and it's no coincidence: INP does not exist in the lab, due to a lack of interactions, and TBT is only an approximation at load time.
What do PageSpeed Insights and Lighthouse have in common?
Both tools run the same analysis engine, Lighthouse, and therefore produce the same performance score and the same recommendations for a given page. PageSpeed Insights is Lighthouse run on Google's servers, in a North American, European, or Asian data center depending on the load, with an imposed network and hardware configuration.
The PageSpeed Insights documentation specifies that Lighthouse simulates a mid-range device, a Moto G4, on a mobile network, and an emulated desktop on a wired connection. The first tool therefore performs the test via Google's infrastructure, the second via your own machine and your own connection, which explains most of the discrepancies between the two. The results are presented in a visually identical interface, adapted for mobile and desktop:
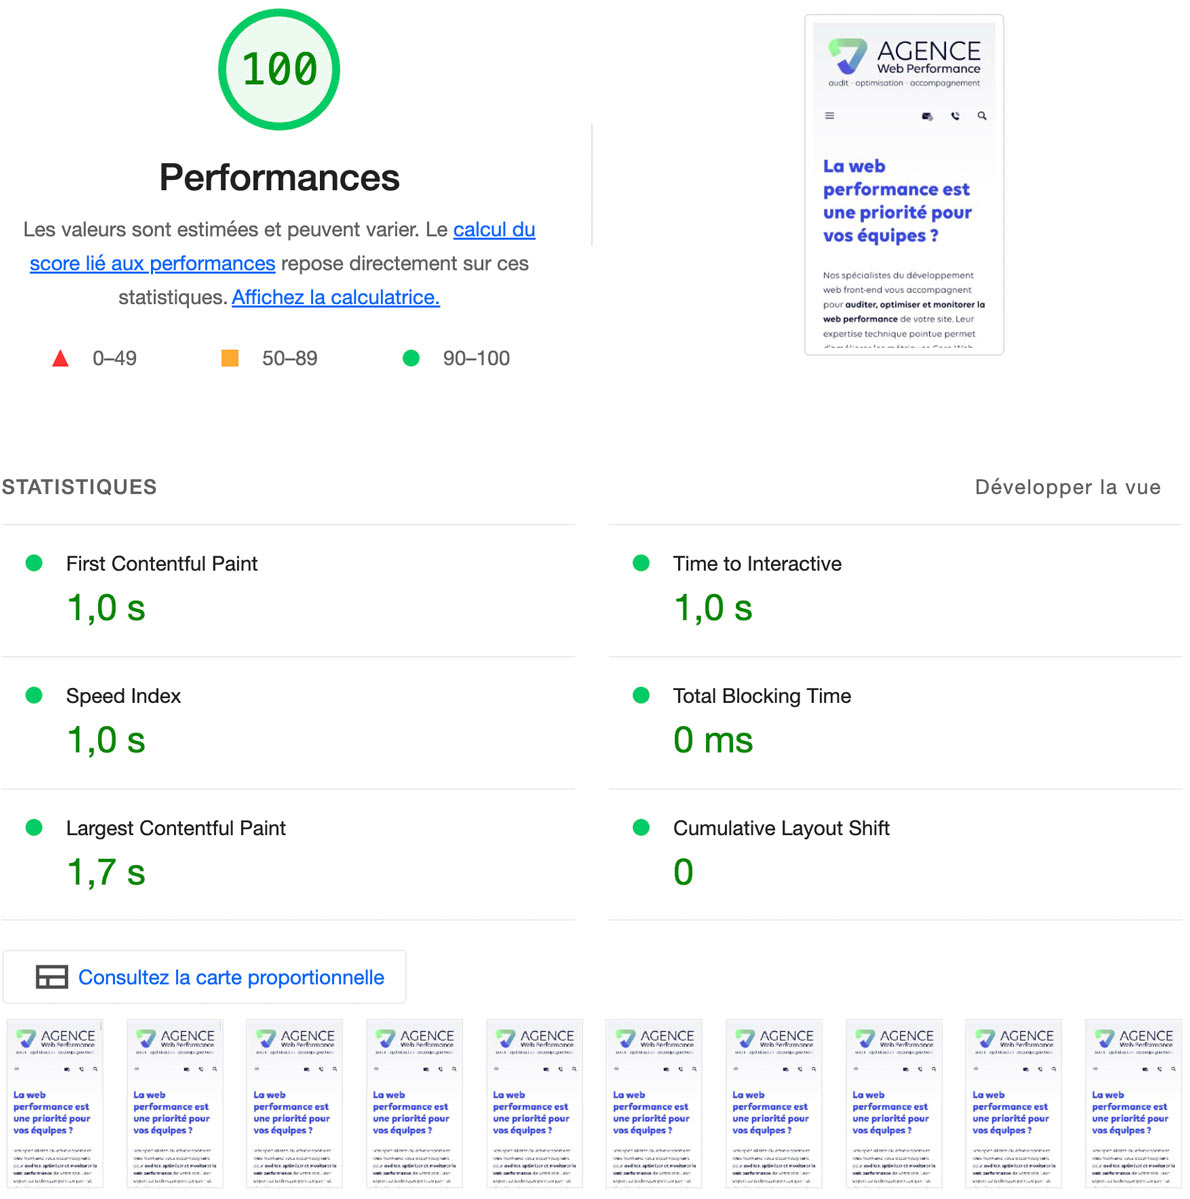
This common layout is divided into three sections. A global performance score out of 100, calculated transparently from lab metrics, orange from 50 and green from 90. The five main metrics, FCP, Speed Index, LCP, TBT, and CLS, intended to reflect user experience. And a filmstrip view of the loading steps, which allows you to spot excessively high TTFB, a main image discovered late, or layout shifts at a glance.
Since Lighthouse 13, old audits have been replaced by insights, the same ones as in the DevTools Performance panel.
For both, you need to take a step back: this data is only a snapshot at a given moment, under conditions that probably do not reflect those of your visitors. The PageSpeed Insights documentation states it plainly: good lab data does not necessarily mean that the real user experience will be good. A green score does not guarantee passing Core Web Vitals in the field, and only CrUX data matters to Google.
Is your site as fast as your visitors expect?

What are the differences between PageSpeed Insights and Lighthouse?
PageSpeed Insights adds CrUX field data, absent from Lighthouse; Lighthouse, locally, analyzes four sections instead of just one, accepts non-public pages, and allows you to choose the simulated device and network. One is used to position a site, the other to diagnose it, including in pre-production or behind authentication.
| Criterion | PageSpeed Insights | Lighthouse |
|---|---|---|
| Field data | Yes, via CrUX, 28-day rolling | No |
| Lab data | Yes, Lighthouse engine | Yes, locally |
| Sections analyzed | Performance | Performance, accessibility, best practices, SEO |
| Execution environment | Google servers, simulated Moto G4, imposed | Your machine, configurable |
| Private or local pages | No | Yes |
| Recommended use | Position and track | Diagnose and test |
The decisive line in this table is the first one. Only PageSpeed Insights exposes field data, the data that Google uses to evaluate your site: a lab score of 100 on a page with poor field Core Web Vitals is worthless for SEO. The reverse is also true, and much more frequent than we think: a score of 70 with a completely green field means the site is doing well.
Lighthouse, beyond performance
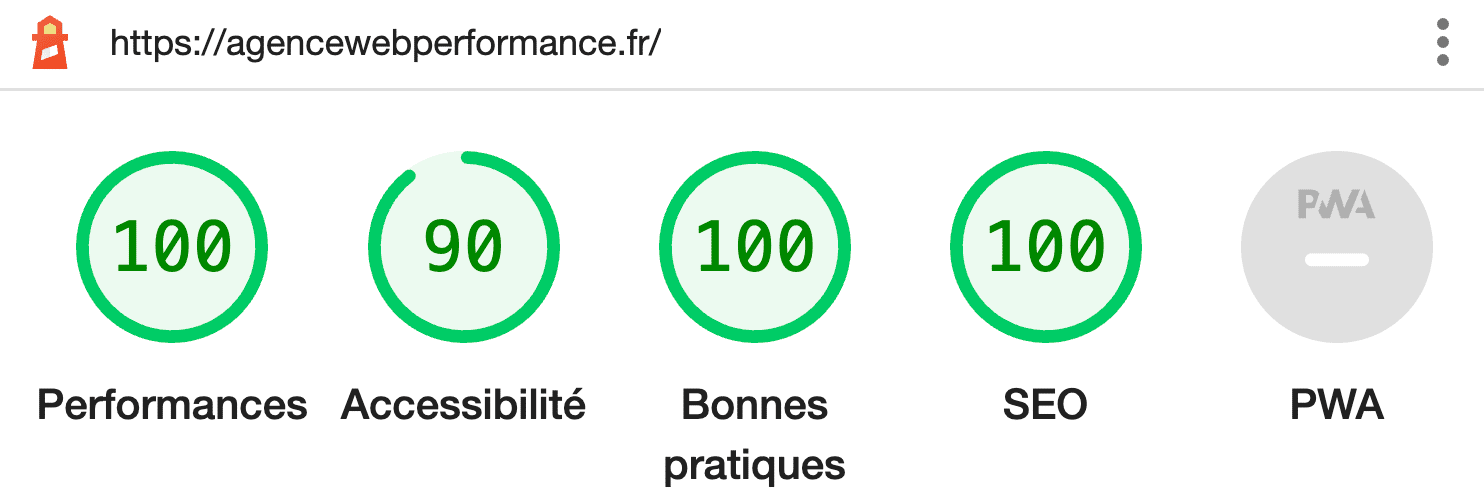
Lighthouse is not limited to performance: it also analyzes accessibility, best practices, and SEO, each scored out of 100. These three sections are absent from the public PageSpeed Insights score. This makes it a recipe tool, executable before each production release, including via command line in a continuous integration:
# Lighthouse en ligne de commande : les quatre volets, en JSON, sur une page de preproduction
npm install -g lighthouse
lighthouse https://preprod.exemple.fr/produit/ \
  --preset=desktop \
  --only-categories=performance,accessibility,best-practices,seo \
  --output=json --output-path=./rapport.json

# Les scores, entre 0 et 1
jq '.categories[] | {id, score}' rapport.json

# Les insights de performance qui ont echoue (Lighthouse 13)
jq '.audits | to_entries[] | select(.key | endswith("-insight")) | select(.value.score != null and .value.score < 0.9) | .key' rapport.json
These complementary measures do not replace an accessibility audit within the meaning of the RGAA or an SEO audit, but they allow you to take the temperature in a few seconds and detect gross regressions with each deployment. As web performance is a cross-disciplinary subject, it is common for an expert to address these related topics, and Lighthouse is the first, least expensive approach to do so.
PageSpeed Insights, with field data added
PageSpeed Insights displays, above the lab score, the Core Web Vitals actually measured on your site by Chrome users over the last 28 days. This section only appears if your traffic is sufficient to feed the CrUX : the documentation specifies that if there is no data for the page, the tool falls back to the entire origin, and if there is no data for the origin, it displays nothing. Its absence signals a site that is too little visited to appear in the public database, not a fast site.
This section is presented first, before the summary analysis, and this is not a layout coincidence. It is important to clearly distinguish the section "Discover your users' experience," which deals with field data, from the one titled "Analyze performance issues," which deals with lab data. The first tells you if you have a problem, the second helps you understand which one :
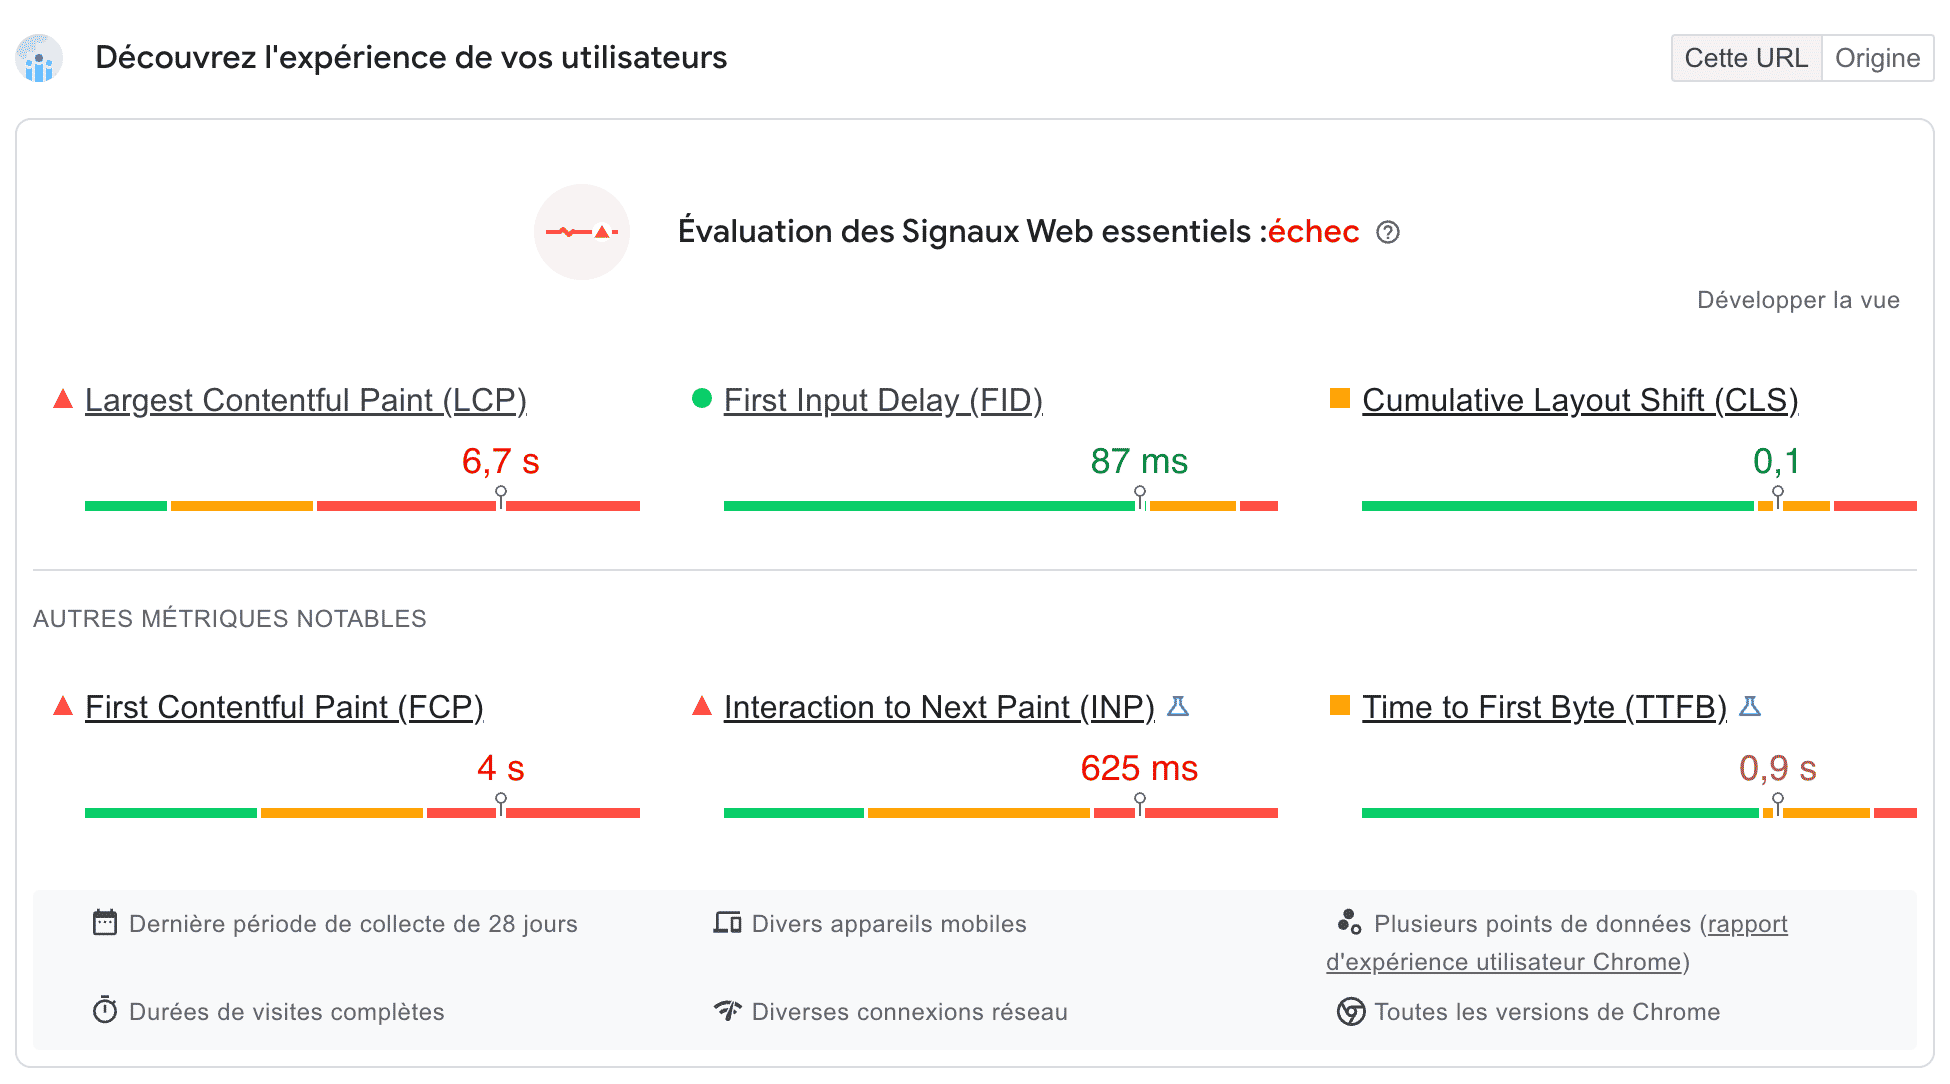
The panel is read in four areas. To the right of the title, a selector switches between the page metrics, This URL, and those of the entire site, Origin, which is very useful for identifying a cross-cutting problem. At the top center, the tool indicates whether the page or site passes the Core Web Vitals assessment. In the center, the field metrics in distribution bars, including the three Core Web Vitals, LCP, INP, and CLS, plus FCP and TTFB.
At the bottom, on a gray background, the data collection conditions, with the rolling 28-day period, which explains the inertia of these figures : a correction deployed today takes almost a month to be fully reflected.
How to interpret a Lighthouse score?
A Lighthouse score is read in three tiers: 90-100 is good and green, 50-89 requires fixes and is orange, and below 50 is poor and red. This score is not a measure of site quality, but a weighted average of five lab metrics, where Total Blocking Time alone accounts for 30 %.
A weighted average, not a grade
Weighting explains most misunderstandings. The score calculation documentation gives the weights in effect since Lighthouse 10: First Contentful Paint 10%, Speed Index 10%, Largest Contentful Paint 25%, Total Blocking Time 30%, Cumulative Layout Shift 25%. TBT and LCP therefore account for more than half the score, and gaining ten points does not require the same effort depending on the target metric: two sites with the same score can have opposite profiles, one slow to display and responsive, the other the reverse.
Variability, and what is not a signal
Two successive runs on the same page commonly yield scores that differ by several points. The same documentation acknowledges this: a large part of the variability does not come from Lighthouse but from underlying conditions, A/B tests or ads served, network routing, test device, extensions injecting JavaScript, antivirus software.
Google also recommends viewing a site's performance as a distribution of scores rather than a single number, and specifies that a perfect score of 100 is extremely difficult to achieve and is not expected. A difference of less than five points is not a signal; it's measurement noise.
What changed with Lighthouse 13
The score hasn't changed, but the recommendations have changed form. Since Lighthouse 13, released on October 10, 2025, and deployed in PageSpeed Insights the following week, the old audits have been replaced by common insights from the Performance panel in DevTools: document latency, LCP discovery and phases, CLS culprits, blocking rendering, third parties. Barry Pollard from the Chrome team announced this as early as April 2025, clarifying the logic behind this consolidation.
In some cases, the advice from many audits is grouped into a single insight, and we have removed some advice.
Barry Pollard, Web Performance Developer Advocate at Google, in his post Lighthouse is moving to performance insight audits, published on April 28, 2025
Among the removed advice are the audit for third-party facades, offscreen images, and preloading, which were deemed too often counterproductive. A 2026 report therefore no longer resembles a 2024 report, and guides that still list the old audits are outdated. What Lighthouse will never see, however, has not changed: the lab score has no ranking value. Google uses field Core Web Vitals, at the 75th percentile, and a site can pass them with a score of 75.
Which tool to choose between PageSpeed Insights and Lighthouse?
Use PageSpeed Insights to know where you stand, Lighthouse to understand why and fix. The first is the arbiter, as it carries the data that Google uses ; the second diagnoses, on any page, even private, with the device and network you choose. Relying solely on the lab score is the most common mistake we encounter.
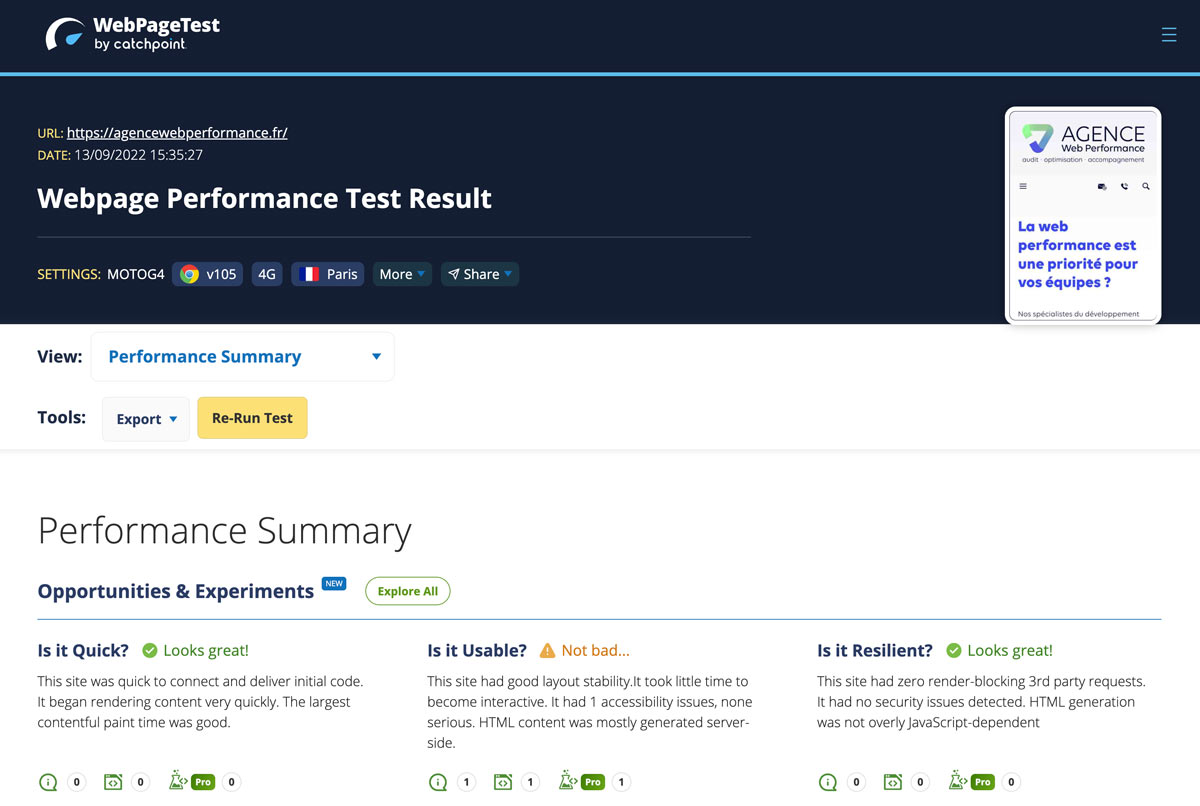
The two tools approach web performance from a particular angle, and they complement each other at all levels. Ideally, they are just one piece of a larger ecosystem. At the agency, we also use tools that don't come from Google: WebPageTest and GTmetrix, which offer many more testing options, detailed waterfall, domain blocking, journey scripts, repeat views; and dozens of specialized tools, on CLS, HTTP headers, fonts, or security.
Our article on measuring web performance situates each within this landscape, and the guide on third-party scripts shows how domain blocking settles a debate in five minutes.
There remains a case where neither is sufficient. An iframe widget, a chat, or a review block, produces CLS and INP that CrUX counts but neither Lighthouse nor a custom RUM sees, and a tag manager degrades INP with every click without ever appearing in a loading report. These blind spots will be the subject of dedicated guides for customer relationship widgets and Google Tag Manager.
In absolute terms, the only data you cannot do without is that of the Chrome User Experience Report, and Search Console already gives you access to it via the Core Web Vitals tab, with more detail than PageSpeed Insights. Neither of the two tools is therefore indispensable: the essential thing is to know what question each can answer, which is precisely the starting point of a web performance audit.