Consent Management Platforms, which we will refer to by the acronym "CMP" in the rest of this article, occupy a unique position in the loading of a web page: they are the first element a new visitor sees, even before your content. As soon as a site drops a tracker that is not strictly necessary, their presence is imposed by the GDPR / ePrivacy framework, and they therefore appear on almost all European sites.
This privileged position comes at a cost: a CMP loads early, executes before the marketing scripts to which it transmits the consent status, and overlays all entry pages. Depending on the technical choices of its provider and how it is integrated, it can degrade all Core Web Vitals metrics:
- LCP, when its script blocks rendering or when the banner itself becomes the LCP element of the page.
- INP, the consent click often being the slowest interaction of the entire session.
- CLS, when the banner inserts itself late into the page flow or animates clumsily.
- The overall health of the DOM, with some tools injecting hundreds of nodes to list their advertising partners.
In 2023, we published a comparison of the performance of 11 CMPs here, rated on 12 technical checkpoints. Three years later, this ranking no longer makes sense: INP joined the Core Web Vitals in March 2024, Google's Consent Mode v2 and IAB's TCF v2.2 have reshuffled the cards, and most providers have thoroughly reworked their scripts. We have therefore completely rewritten this page in a more sustainable form: understanding the mechanisms by which a CMP degrades performance, in order to be able to evaluate any tool, today and tomorrow.
Why is a CMP not a third-party script like any other?
A chat or heatmap script can be delayed without functional consequence. A CMP, no: it must execute before the scripts it conditions. This is the whole principle of Google's Consent Mode v2, mandatory since March 2024 for European advertisers: as long as consent is not known, advertising and analytics tags function in degraded mode. Similarly, the __tcfapi API of IAB Europe's TCF must be available as early as possible for the programmatic advertising chain to function. Result: the CMP is mechanically placed in the critical loading path.
It also concerns 100% of new visitors, on their entry page, precisely the one where LCP and the first impression are determined. Where a site builds loyalty, the impact is diluted; where acquisition dominates (SEO, Discover, campaigns), a major part of sessions begins with the display of the banner. This is also the experience measured by default by Lighthouse and PageSpeed Insights, which always test a first visit without any consent.
Finally, a CMP loaded from a third-party domain constitutes a single point of failure (SPOF): SpeedCurve documents the case of a synchronous consent script whose timeout froze the page rendering for several seconds. When the publisher's infrastructure coughs, it's your site that turns white. This risk, common to all external scripts, is amplified here by the CMP's position in the loading process. We detailed it in our article on the impact of third-party JavaScript.
Six mechanisms by which a CMP degrades performance
To choose a tool with full knowledge, one must understand how the degradation occurs. Here are the six mechanisms we systematically encounter in audits, from the most obvious to the most insidious.
1. A blocking script delays everyone
Some CMPs still recommend integration via a synchronous <script> tag, sometimes placed at the very top of the <head>. The browser then interrupts the page construction while it downloads and executes the script: FCP and LCP are pushed back accordingly, even for visitors who have already consented and will never see the banner. The official recommendation from web.dev is unambiguous: asynchronous loading (async attribute), direct call in the HTML, and early connection to the CMP domain via preconnect.
Blocking can also be indirect: many tools work in a cascade, with an initial "stub" script that loads the full SDK, which in turn loads a JSON configuration, translations, and sometimes a stylesheet. Each link adds latency, and the banner only appears at the end of the chain. DebugBear illustrates this phenomenon with the otSDKStub.js / otBannerSdk.js pair from OneTrust, where the second, low-priority request significantly delays the banner's appearance.
The worst-case scenario, however, remains loading the CMP via a tag manager. A script injected by Google Tag Manager is only discovered after GTM itself has been downloaded and executed: it escapes the browser's pre-parser, inherits a lower network priority, and is added at the end of the dependency chain. The CMP, which should be one of the first scripts on the page, ends up deprioritized on the critical path it nevertheless conditions. web.dev puts it bluntly: the consent script is called directly in the document's HTML, never via a tag manager or an intermediate script.
This detour is sometimes imposed by the organization: CMP managed via Google Tag Manager, or an inline snippet that injects the <script> tag asynchronously. In both cases, the script's URL does not appear in the initial HTML, and the browser's preload scanner cannot discover it. A <link rel="preconnect"> to the CMP's domain then allows opening the connection even before the script is requested: DNS resolution, TCP connection, and TLS negotiation are already paid for when the request is made, subtracting that much latency from the banner's display. This is the safety net that web.dev recommends, in addition to the direct call, never instead of it.
2. The overlay can become your LCP
LCP measures the display time of the largest element visible in the viewport, whether it's an image or a text block. However, a CMP displayed as a central overlay often contains several paragraphs of legal text: on mobile, where it takes up a significant portion of the screen, this text block frequently becomes the page's LCP element, at the expense of your own content.
The consequences are doubly perverse. First, as the banner appears at the end of the request chain, the measured LCP degrades: DebugBear shows a case where it goes from 1.43s to 3.61s when the OneTrust text surpasses the main image in size. Second, your measurement becomes blind: as long as the "official" LCP is that of the banner, no optimization of your hero image will appear in the numbers. SpeedCurve rightly speaks of "bad LCP element": you think you're measuring your site, but you're measuring your CMP.
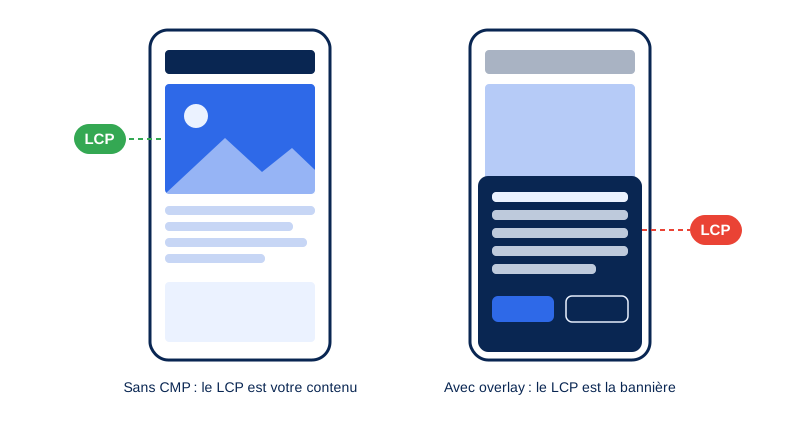
At the time of choice, this mechanism argues for a compact banner, of the discreet band type at the bottom of the screen rather than a full-screen modal saturated with text. An element significantly smaller than your main content will never be an LCP candidate.
3. Late insertions cause layout shifts
When a banner inserts itself into the page flow (typically at the top of the screen) after the surrounding content has already appeared, everything below it is brutally pushed down: this is one of the most common causes of poor CLS. web.dev recommends either reserving space in the DOM before rendering or displaying the banner as an overlay (sticky footer or modal), which doesn't move anything. Appearance animations are the second pitfall: an animated "slide-in" via the top or left properties generates layout shifts on each frame, whereas an animation using transform produces none.
4. The consent click, often the slowest interaction of the session
The INP penalizes the slowest interaction of a session (at the 75th percentile of users). However, clicking "Accept All" is structurally costly: within the same event handler, the consent is written, the TCF string is encoded, dozens of third-party callbacks are notified, all pending marketing tags are triggered in rapid succession, and then the interface is closed and removed from the DOM.
Until this long task is completed, the screen does not update: the banner appears frozen, the user clicks again, and the INP skyrockets. This is all the more detrimental because this click is, for many visitors, the first interaction with the site, the very one that has a good chance of becoming the session's retained INP.
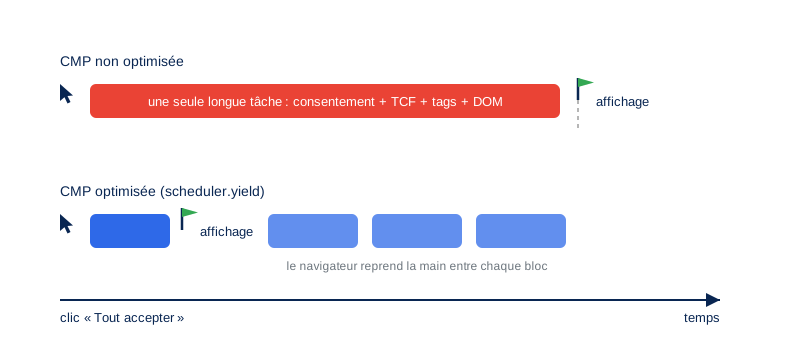
This problem is correctable by publishers, and some have demonstrated it. The case study published by Google with PubTech details the techniques used: breaking down long tasks with scheduler.yield() and scheduler.postTask() to let the browser paint between steps, and "lazy de-rendering," which consists of immediately hiding the banner with display: none and then only removing its DOM nodes later, via requestIdleCallback. Result: up to 64% reduction in INP for their clients, and long tasks attributable to the TCF library reduced by 85% on mobile.
The lesson for your choice of tool: ask the publisher what they do with your click. A vendor unable to answer "we hand control back to the browser before processing tags" has likely never measured their INP.
5. Hundreds of partners in your DOM
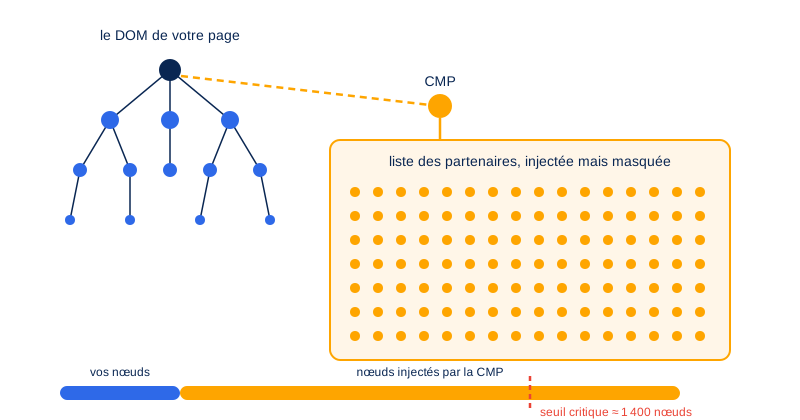
Sites monetized by programmatic advertising rely on the TCF, whose Global Vendor List references several hundred companies. TCF v2.2 also requires announcing the number of partners on the first screen. Some CMPs draw a disastrous conclusion for performance from this: they pre-build, from the initial load, the secondary panel listing each partner with its checkbox, name, and purpose text. Hundreds of hidden lines, but present in the DOM.
However, DOM size is never free: each node increases style recalculations, layout, and memory usage, and directly degrades interactivity. Lighthouse considers that beyond approximately 1,400 nodes, a page enters a critical zone. A CMP that injects several hundred nodes on its own can push a healthy page into the red.
During our 2023 comparison, initial interfaces ranged from 40 to 210 nodes, a factor of 5 difference between the leanest and the most verbose, even before opening the partners panel. Best practices do exist, however: build the partner list on demand, when the user opens the panel, paginate or virtualize it, and ideally encapsulate the interface in a Shadow DOM to isolate its styles from those of the page.
6. Weight, domains, cache, and compression: the fundamentals remain
The fundamentals of any third-party script remain, where the gaps between CMPs are still considerable. First, the JavaScript volume: for equivalent functionality, we measured in 2023 a ratio of 1 to 10 between tools, some exceeding 200 KB compressed. Every kilobyte is downloaded, parsed, and executed on the often modest CPU of your visitors' mobile devices.
Then, the ancillary exchanges: configurations and JSON translation files of several tens of KB, bloated stylesheets injected inline. Finally, delivery: a single domain served by a CDN on HTTP/2 or HTTP/3, Brotli compression, and a browser cache policy of at least one day should be obvious. However, in 2023, we noted cache durations of 11 minutes, forcing the script to be re-downloaded almost every session.
The paradoxical effect: a CMP also postpones the execution of third-party scripts.
Not everything is a burden, and it must be said clearly: a CMP also has a beneficial effect on initial loading. As long as the user has not expressed their choice, it blocks or postpones the execution of third-party scripts that it controls. Some are entirely absent from the page (no bytes downloaded, no tasks executed), while others, driven by Consent Mode, are only partially loaded, in a degraded mode without cookies. The first visit is therefore mechanically lighter: fewer requests, less JavaScript, fewer long tasks, as long as the banner is on the screen.
This lightening, however, has a downside for measurement: synthetic tests reproduce this state precisely. Lighthouse and PageSpeed Insights test a first visit without consent, in which a large part of the third-party scripts has simply disappeared. SpeedCurve quantifies the difference in a real-world case: the "consented" experience of the same site loads 73 additional third-party requests, with the accompanying CPU activity and long tasks. The test report therefore describes a site that is significantly more performant than it actually is for the majority of your visitors, who browse in a consented state.
The solution is always the same: test both states (before and after opt-in, by scripting the click or pre-setting the consent cookie) and, above all, trust the field data. RUM and CrUX aggregate all sessions, consented or not: it is there, and not in a Lighthouse report, that the real impact of your CMP and your third-party scripts can be seen.
Is your site as fast as your visitors expect?

What our 2023 comparison highlighted
Our 2023 comparison rated 11 tools (Axeptio, Cookiebot, Cookie Law, CookieYes, Didomi, Iubenda, OneTrust, Osano, Quantcast Choice, Sirdata, Usercentrics) on 12 control points. Osano won with 72 %, and no tool exceeded three-quarters of the maximum score. Above all, each player failed on a different point, each illustrating the mechanisms described above :
- Cookiebot provided a synchronous integration code of 34 KB, injected 209 nodes into the DOM, and served its script with an 11-minute cache, the shortest in the panel.
- Sirdata loaded 146 KB from a non-CDN domain, over HTTP/1.1, the only player in the panel in this case.
- Usercentrics and OneTrust downloaded 206 and 124 KB of asynchronous JavaScript, respectively.
- Didomi injected 80 KB of CSS into a
<style>tag, Quantcast Choice exchanged 83 KB of JSON upon loading, before any interaction. - Cookie Law and CookieYes bloated the DOM (208 and nearly 140 nodes, with a median of 84), while Axeptio loaded 51.6 KB of images in its banner.
At the end of 2023, we supplemented this "laboratory" snapshot with RUM data collected from a large sample of sites, ranking CMPs by INP at the 75th percentile : from 26 ms for Usercentrics to 241 ms for Cookiebot, including CookiePro (49 ms), Cookie Law (58 ms), CookieYes (60 ms), Consentmanager (171 ms), and Funding Choices (200 ms). Two lessons learned : the field ranking did not match the laboratory ranking (Cookie Law, poorly rated in the lab, performed honorably in the field), and the positions shifted as publishers updated their scripts.
This is precisely why we do not republish a fixed ranking. A score assigned on day X is a snapshot of a script version that the publisher can replace the next day, and several of the actors mentioned above have indeed made significant corrections since then. And your own configuration (integration mode, language, partner list, graphic customization) weighs as much as the tool itself. A ranking becomes obsolete; a set of criteria can be reused.
The Choice Grid: 10 Criteria for Evaluating a CMP
Here is the grid we use in audits and consulting. It is directly derived from the mechanisms described above, and each criterion can be objectively verified, with the help of testing tools.
| Criterion | What to demand |
|---|---|
| Loading method | Asynchronous script (async), called directly in the HTML, never synchronously or via a tag manager |
| Connections | A single domain, served by a CDN, compatible with preconnect |
| JavaScript weight | A few tens of KB compressed maximum, in Brotli |
| Request chain | Banner displayable in one to two requests, without cascading configurations or large translations |
| Browser cache | Cache-Control of at least one day |
| Display | Compact banner (band or reduced modal), overlay, or placeholder, animations using only transform |
| Injected DOM | Initial interface of a few dozen nodes, partner list built when opening the panel, Shadow DOM preferred |
| Interactions | Immediate visual feedback on click, split tag processing (scheduler.yield), deferred DOM removal |
| Consent signals | Consent Mode v2 and, if your monetization requires it, TCF v2.2 (__tcfapi) correctly exposed |
| Graphic sobriety | No images or fonts loaded from remote domains; inherit site fonts |
How to test it yourself?
Three manipulations are enough to differentiate candidates. First, compare the first visit and the "consented" visit: WebPageTest allows you to script the click on the banner or pre-set the consent cookie, and the difference between the two recordings reveals the real cost of the tool.
Second, profile the "Accept All" click in the Performance tab of DevTools: the processing time of the interaction, and the list of scripts running during it, do not lie. Third, in production, monitor INP and long frames (Long Animation Frames API) in RUM: if your CMP script appears at the top of the blocking scripts, you've found your culprit.
Finally, keep in mind that synthetic tools only test the first visit: only real-world data reflects the reality of mostly already consented traffic.
Don't let the CMP blind your measurement
Last blind spot: the CMP also conditions your measurement tools. If your RUM or analytics solution is subject to consent, every refusal is an invisible session: your performance data only describes consenting visitors. web.dev reminds us that performance measurement technically requires no cookies (the web-vitals library is an example), and that it may be relevant to isolate audience measurement in a separate consent category, or even opt for a solution exempt from consent according to CNIL. One more criterion to consider when choosing.
The WordPress case: the CMP as an extension, without remote script
WordPress allows for a structurally different approach: the CMP installed as an extension, which generates the banner from your own domain, without relying on a remote service. Complianz is the most advanced example (the extension claims to operate entirely self-hosted, without external API calls), and the French open source tarteaucitron follows the same logic.
Performance benefits are direct. No more DNS resolution or TLS negotiation to a third-party domain, no more external SPOFs: the script is served by your server, with your cache policy, your compression, and your HTTP protocol, alongside your other resources. The embedded weight is generally an order of magnitude smaller than that of a SaaS CMP. And since the banner can be rendered in the initial HTML, space can be reserved from the first display: no late appearance, no layout shift, no request chain.
Three limitations, however, deserve to be stated. First, an extension remains code executed on each PHP request and assets added to the front-end: its quality is verified like that of a theme.
Second, configuration requires a technical profile: tarteaucitron, for example, embeds dozens of service configurations that must be pruned to avoid loading unnecessary JavaScript, and cache or optimization extensions must be configured not to defer the consent script; Complianz documents these exclusions for WP Rocket or LiteSpeed.
Finally, a programmatic ad-monetized press editor will need a complete TCF registration that local extensions do not cover all: for a fleet of heterogeneous sites or advanced legal needs, SaaS CMP remains relevant.
For a showcase site, an e-commerce store, or a WordPress blog whose trackers are limited to analytics and a few marketing pixels, our position is clear: the well-configured local extension is the most performant option, quite simply because it eliminates most of the degradation mechanisms described in this article instead of mitigating them.
What to remember
A CMP is a regulatory necessity, not a performance fatality. The gaps between tools are significant, degradation mechanisms are known, and each can be objectively tested:
- Demand asynchronous and direct loading, without going through a tag manager, from a single domain on CDN, with long cache and minimal weight.
- Prefer a compact banner that can neither become your LCP nor cause a layout shift.
- Profile the consent click: it is what will determine your INP with new visitors.
- Refuse interfaces that dump their hundreds of partners into your DOM upon loading.
- On WordPress, seriously consider the option of a local extension without remote scripts.
- Beware of flattering synthetic scores: without consent, a large portion of third-party scripts do not load.
- Measure in RUM, before and after any tool change, and re-challenge your CMP at each contract renewal.
As in 2023, let's finally recall that performance is only one criterion among others, alongside regulatory compliance, features, and cost : this guide sheds light on a blind spot, it does not replace your lawyer or your marketing team. We remain available to discuss and answer your questions : feel free to post a comment below or contact us via the contact form.