
Every time a browser, a crawler, or an application requests a resource on the web, the server responds with a three-digit number before sending even a single line of content. This number is the HTTP status code, the first piece of information the client receives, and it indicates in a single token whether the request succeeded, was moved elsewhere, was denied, or if the server itself failed. A 200 signals success, a 404 an unfindable resource, a 500 a server-side failure.
These codes are standardized by RFC 9110, published in June 2022 to replace RFC 7231, and the official registry listing them is maintained by the IANA. Almost everything written about them in French stops at this definition layer: a table, a label, a translation. This misses the essential for anyone managing a site, because a status code is not just information. It is an event that consumes server resources, delays rendering, and feeds a quality signal to search engines.
A 301 redirect adds a full network round trip before the target page even starts responding. A misconfigured 404 error triggers the full execution of the application instead of a static response, and under scanner traffic, this is enough to increase server load. A flurry of 5xx errors causes Googlebot to slow down its crawling, with a delay effect that lingers long after the incident is resolved. So, how much does each of these codes really cost, and which ones should be returned in which situations?
What is an HTTP status code?
An HTTP status code is a three-digit integer, returned by a server in the first line of its response, indicating to the client how its request was processed. RFC 9110 defines their semantics and divides them into five classes identified by their first digit. Only this first digit is normative for client behavior: a client encountering an unknown code should treat it as the x00 code of its family.
The complete response is not limited to the number. It also carries a set of headers that specify what the client should do with this information: Location for a redirect, Retry-After for temporary unavailability, ETag and Last-Modified for cache validation. The code announces the nature of the response, the headers provide the details, and it is the combination of the two that determines the actual behavior of the browser.
How to check the status code of a page?
The fastest way to read a status code is the curl command with the -I option, which only sends a HEAD request and displays the headers without downloading the response body. This check takes less than a second and is essential as soon as you suspect a discrepancy between what the page displays and what the server declares.
$ curl -I https://exemple.fr/ancienne-page/
HTTP/2 301
location: https://exemple.fr/nouvelle-page/
cache-control: max-age=3600

$ curl -I https://exemple.fr/nouvelle-page/
HTTP/2 200
content-type: text/html; charset=UTF-8
The Network tab in the browser's developer tools provides the same information for all resources on a page, with a Status column that can be sorted and filtered. This is the first reflex for an audit: filter by codes other than 200 to immediately see what is redirecting, what is missing, and what is failing to load on a given page.
Why does an HTTP status code cost server resources?
A status code is never free, because a response must be produced somewhere before being sent. The same code can cost several thousand times more depending on where it is produced: a rule-based redirect on a CDN never touches the origin server, whereas the same redirect set by a WordPress plugin starts the entire PHP application and queries the database to only send back a simple header.
This distinction is the common thread throughout what follows. Three production levels exist, and they are incomparable in terms of consumption.
| Production level | What is mobilized | Cost | Typical examples |
|---|---|---|---|
| Edge, CDN, or WAF | Nothing on the origin | Almost zero | Cloudflare rule-based redirect, security block, rate limiting |
| Web server (Nginx, Apache) | Configuration reading | A few milliseconds | Configuration redirect, 404 for a missing static file |
| Application (PHP, WordPress) | Full startup, SQL queries, template rendering | High, comparable to a full page | Redirect via plugin, 404 handled by the application router |
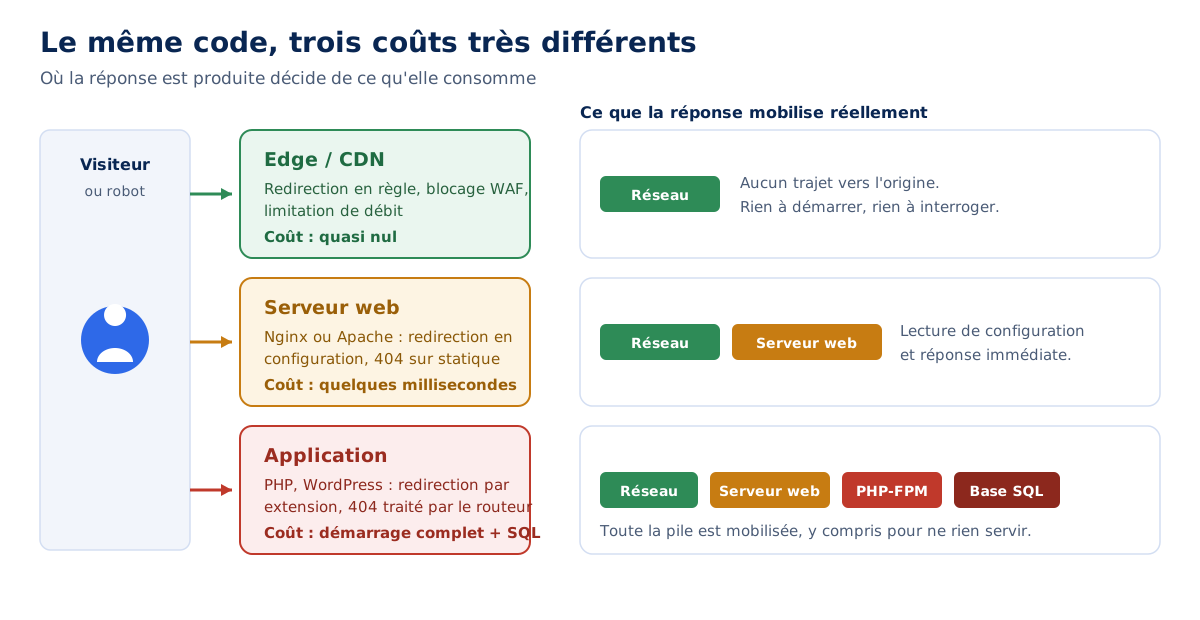
The table is read in only one direction: the higher the response goes up the stack towards the application, the more expensive it is, and this remains true whether the response is a success, a redirection, or an error. A 404 produced by Nginx for a missing file costs tenths of a millisecond. The same 404 returned by a CMS router mobilizes an entire application process, often for several hundred milliseconds.
The practical consequence is immediate: the question to ask when faced with a status code is not just what code to return, but where to produce it. Each family of codes is then read through this grid.
What are the five families of HTTP codes?
Status codes are divided into five classes, each identified by its first digit, and each imposing a different default behavior on the client. Knowing the family is enough to know what to do with a code you've never encountered before.
1xx, informational responses: the server indicates that it has received the request and is continuing its processing. The final response will follow. This family includes100 Continue,101 Switching Protocolswhen switching to WebSocket, and103 Early Hints, the only one in the family that directly impacts performance;- 2xx, success: the request has been received, understood, and processed. The expected content is there, or the requested operation has been successfully performed;
3xx, redirections: the resource is located elsewhere, or the client's cached copy is still valid. The client must issue a second request, or reuse what it already has;4xx, client errors: the request is faulty from the server's perspective. Non-existent URL, unauthorized method, missing authentication, unacceptable format;5xx, server errors: the request was valid, but the server could not respond to it. This is the only family whose responsibility lies entirely with the hosting and the application.
This breakdown is not just a writing convention. Google's documentation on crawling describes different processing for each family: the content of a 2xx response is sent to the indexing pipeline, 3xx are followed up to ten hops, the content of 4xx is ignored and the URL eventually drops out of the index, and 5xx trigger a slowdown in crawling.
However, the behavior within a family varies greatly, and this is where the real trade-offs are made.
What does the HTTP code 200 and other 2xx codes mean?
200 OK means the request succeeded and the response body contains the requested resource. This is the code returned by a page that displays normally, and MDN specifies that its meaning depends on the method used: on a GET, the resource is in the body; on a POST, it's the result of the action. However, a 200 does not guarantee indexing, as Google explicitly states in its crawling documentation.
In terms of performance, 200 is the most costly code in the family, as it transmits the entire resource. The entire challenge of optimization consists precisely in issuing as few of them as possible for content that the client already possesses, which caching and validation allow.
What do codes 201, 202, 204, and 206 mean?
201 Created confirms that a resource was created as a result of the request, typically after a POST to an API, and the Location header indicates where it is now located. 202 Accepted signals that the request is being processed but will be handled asynchronously, which is the case for queues and deferred processing. Google specifies that its bots then wait for the content for a limited time, which varies depending on the bot concerned, before moving on to the next step with what they have received.
The 204 No Content indicates success without a response body: the operation was successful, there is nothing to display. It is the ideal response for a follow-up call or a deletion, and its performance benefit is real since it avoids transmitting unnecessary bytes. However, be careful on the SEO side: Google cannot process anything from a 204 and considers it to be devoid of content.
206 Partial Content responds to a request with a Range header, and only returns a fragment of the resource. This is the mechanism that allows for continuous playback of a video, resuming an interrupted download, or progressive loading of a large file. On a site that hosts its own videos, the presence of 206 in the logs is normal and expected.
What is the difference between a 301 redirect and a 302 redirect?
The 301 Moved Permanently announces a permanent move: the resource has changed its address for good, and clients should update their references. The 302 Found announces a temporary detour: the original URL remains correct, but the response is located elsewhere for now. Google treats 301 as a strong canonicalization signal and 302 as a weak signal, which its crawling documentation states in these exact terms.
The most consequential practical difference, however, is not on the search engine side, but on the browser side. A 301 is aggressively cached by clients, sometimes permanently, and a permanent redirect made in error becomes very difficult to undo for visitors who have already registered it. As long as a move is not certain and definitive, 302 remains the prudent choice.
To this must be added the 303 See Other, which forces a switch to GET after a form submission to avoid double submission, and the 304 Not Modified, which technically belongs to the 3xx family without being a redirect at all.
What are the 307 and 308 redirects for?
The 307 Temporary Redirect and 308 Permanent Redirect codes take on the semantics of 302 and 301, with a decisive additional guarantee: they preserve the HTTP method and the request body. A POST redirected with 307 remains a POST, with its data intact.
This guarantee does not exist with 301 and 302. For historical reasons, many clients transform a redirected POST into a GET, which silently causes the sent data to disappear. On an order form or an API call, the consequence is a request that appears to succeed when it has transmitted nothing.
Google treats 307 like 302 and 308 like 301, but reminds in its documentation that these codes remain semantically distinct and it is better to use the one that truly corresponds to the intention. The question of cost depends on none of these four codes: it depends on the number of hops and where they occur.
How much time does a redirect cost?
A redirect costs a full network round trip before the target page starts responding: DNS resolution if the domain changes, TCP connection establishment, TLS negotiation, sending the request, receiving the response. On a mobile connection, each hop costs hundreds of milliseconds, and this delay is added in full before the first byte of the actually requested page.
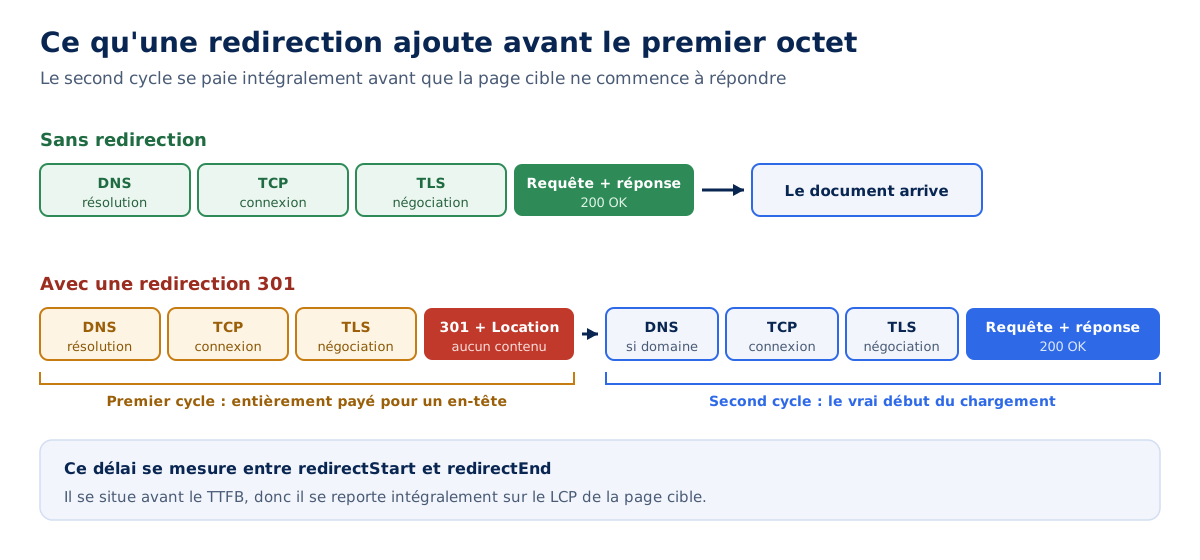
The takeaway is that this cost is paid to receive a Location header and nothing else. No useful content is transferred during this round trip. This is why Lighthouse has a dedicated redirect audit, which flags them as soon as they precede the main document load.
This delay is measurable on the visitor's side thanks to the Navigation Timing API, which exposes the redirectStart and redirectEnd properties on the navigation entry. As it occurs before the TTFB, it impacts all subsequent metrics, starting with the largest contentful paint.
// Délai de redirection réellement subi par le visiteur
const nav = performance.getEntriesByType('navigation')[0];
const redirectMs = nav.redirectEnd - nav.redirectStart;

console.log(`Redirections : ${nav.redirectCount} saut(s), ${redirectMs.toFixed(0)} ms`);
console.log(`TTFB : ${(nav.responseStart - nav.requestStart).toFixed(0)} ms`);
What this measurement almost always reveals on a site that has been around for a while is that the delay is not due to an isolated redirect, but to their accumulation.
Why does a redirect chain degrade performance?
A redirect chain multiplies the unit cost by the number of hops, without any of these hops delivering content. Three successive redirects mean three full network round trips before the first useful byte, and the pattern is common on sites that have chained an HTTPS migration, a URL structure change, and a move away from www.
The typical case reads like this: http://example.fr/product redirects to https://example.fr/product, which redirects to https://www.example.fr/product, which finally redirects to https://www.example.fr/shop/product. Each rule was added separately, at a different time, by a different person. None are wrong taken in isolation.
Crawlers have their own limitations in this regard. Google follows up to ten redirect hops by default, and Search Console reports a dedicated error when a chain becomes too long, loops on itself, or results in an empty URL. The fix is always the same: flatten the chain so that the first request points directly to the destination, with a single rule rather than three in succession.
Where should redirects be placed?
A redirection produced by the application bypasses the page cache: the server executes all the CMS code, initializes the database connection, loads extensions, and finally sends back a header of a few dozen bytes. The cost is that of a full page for zero content, and it is paid for each affected request.
The rule is therefore to handle redirects at the web server level, or even better at the edge, and never in the application code when it is avoidable. A rule written in the Nginx configuration is resolved before PHP is called.
# Nginx : la redirection est résolue avant tout appel à PHP-FPM
location = /ancienne-page/ {
    return 301 https://exemple.fr/nouvelle-page/;
}

# Apache, même principe dans le .htaccess
Redirect 301 /ancienne-page/ https://exemple.fr/nouvelle-page/
A special case is worth knowing, because it completely eliminates the cost of a very common redirection. The Strict-Transport-Security header, or HSTS, tells the browser that the domain should only be contacted via HTTPS. The switch from http to https then becomes an internal rewrite within the browser, without the slightest network trip, whereas a classic redirection would have cost a full one.
How does a 304 code speed up a site?
The 304 Not Modified tells the client that the copy it holds is still valid, and it carries no response body. The browser then reuses its local version instead of re-downloading an identical file. On a 180 KB script, the bandwidth savings are total.
The mechanism relies on two pairs of headers. The server sends a Last-Modified or an ETag with the resource; on the next request, the browser sends them back as If-Modified-Since or If-None-Match. If nothing has changed, the server responds with 304 and the matter is settled in a few bytes.
$ curl -I -H 'If-None-Match: "a3f9c1e"' https://exemple.fr/assets/app.js
HTTP/2 304
etag: "a3f9c1e"
cache-control: max-age=604800
There remains a nuance that most articles omit, and which completely changes the strategy: the network round trip does take place. A 304 is cheaper than a 200, it is not free. On a mobile connection with a latency of 150 ms, twenty resources validated by 304 represent a very real delay before the page is complete.
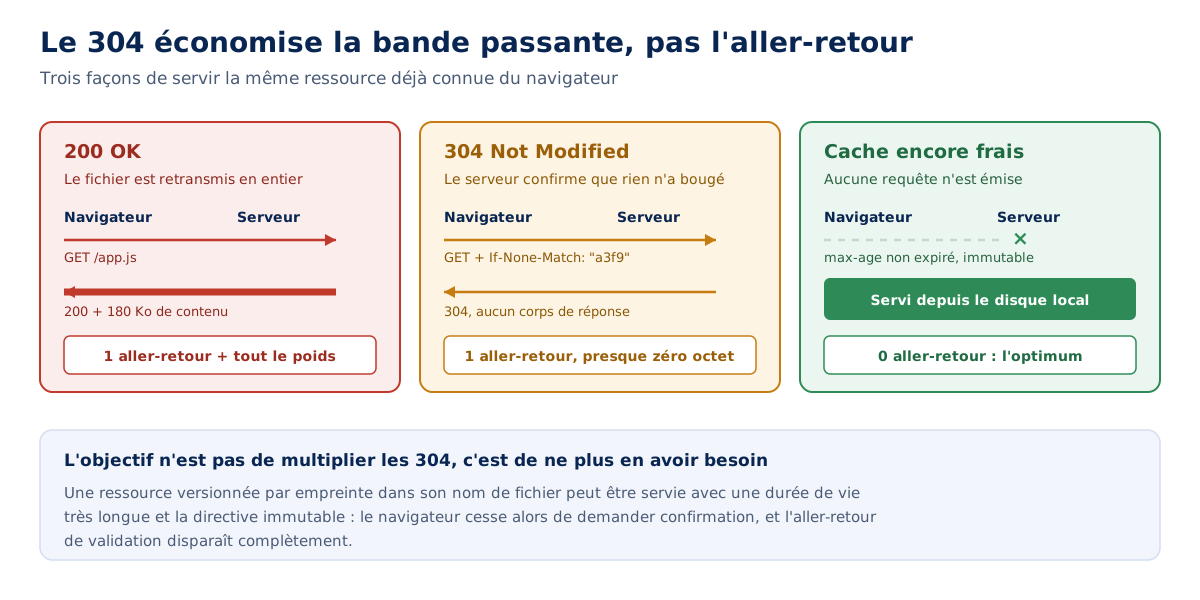
The optimum is therefore not to multiply 304s but to make them completely unnecessary. A resource whose filename contains a fingerprint of the content can be served with a very long lifespan and the immutable directive: the browser then stops asking for confirmation, and the round trip disappears. This is the principle detailed in the web.dev documentation on HTTP caching, and which we develop in our guide on the different caching layers.
# Ressource versionnée : plus jamais de requête de validation
location ~* \.(js|css|woff2)$ {
    add_header Cache-Control "public, max-age=31536000, immutable";
}
Last point, in the logic of the three levels of production: a 304 produced by the application costs exactly the price of a full page, since all the code ran to decide not to send anything. Validation must be handled by the web server, which resolves it on the file's metadata.
What is the HTTP code 103 Early Hints for?
The 103 Early Hints, defined by RFC 8297 in December 2017, is an informational response sent before the server's final response. It allows critical resource download to start early by transmitting Link headers to the browser while the server is still preparing the document.
Its interest is directly proportional to the time it takes the server to produce its response. On a site with a structurally high TTFB, because the page requires calculations or external calls, this dead time is latency during which the browser does nothing. The 103 transforms it into a preloading window.
HTTP/2 103
link: </assets/critique.css>; rel=preload; as=style
link: </fonts/manrope.woff2>; rel=preload; as=font; crossorigin

HTTP/2 200
content-type: text/html; charset=UTF-8
The mechanism is described in detail in Chrome's documentation on Early Hints, and browser support can be checked on Can I Use. This approach naturally complements the work of reducing the first response delay, from which it never dispenses: the 103 masks a high TTFB, it does not correct it.
404 Error: what does this http code mean and where does it come from?
The http code 404 Not Found means that the server found no resource matching the requested URL. RFC 9110 specifies that it does not indicate whether this absence is temporary or permanent, which distinguishes it from 410. The number 404 has no hidden meaning: it is simply the fourth code in the client error family, contrary to the persistent legend of a numbered office 404 at CERN.
For a visitor who stumbles upon it on a third-party site, the causes are almost always the same: a mistyped address, an outdated link on another site, a bookmark to a deleted page, or content moved without redirection. Refreshing the page is useless, as the server is responding correctly: it really has nothing at that address. Checking the URL spelling, going back to the site's root, or using its internal search are the only useful steps.
For those who manage the site, on the other hand, the 404 error is much more than a display inconvenience.
Does a 404 error consume server resources?
On a CMS, an unfound URL is frequently the most costly request on the entire site. It bypasses the page cache, as no version of this URL has ever been cached, triggers the full application startup, executes the main database query, notes its failure, and then loads the error template to display it. All this work is done to serve nothing.
Misconfiguration significantly worsens the phenomenon. When a missing static file is returned to the application controller instead of being processed by the web server, a simple absent image triggers a full application startup. On a site that lost a few dozen files during a migration, each page view pays this price multiple times.
This is exactly the pattern we prioritize looking for in logs during a performance audit on a slow site: the volume of 404s and, above all, the level at which they are produced.
Why can 404 errors increase server load?
The scale effect turns an acceptable unit cost into a production incident. Under the sweep of a vulnerability scanner, a crawler bot, or a wave of broken links, these application 404s persistently tie up PHP processes. The process pool saturates, legitimate requests wait their turn, response times degrade for everyone, and the average server load increases even though no real pages are being served.
The rest is mechanical. When the pool remains saturated, the web server eventually returns 502 or 504 errors on perfectly valid pages, and an incident that was just an excess of 404s becomes a visible unavailability. This is one of the most common failure scenarios on shared hosting and undersized VPS.
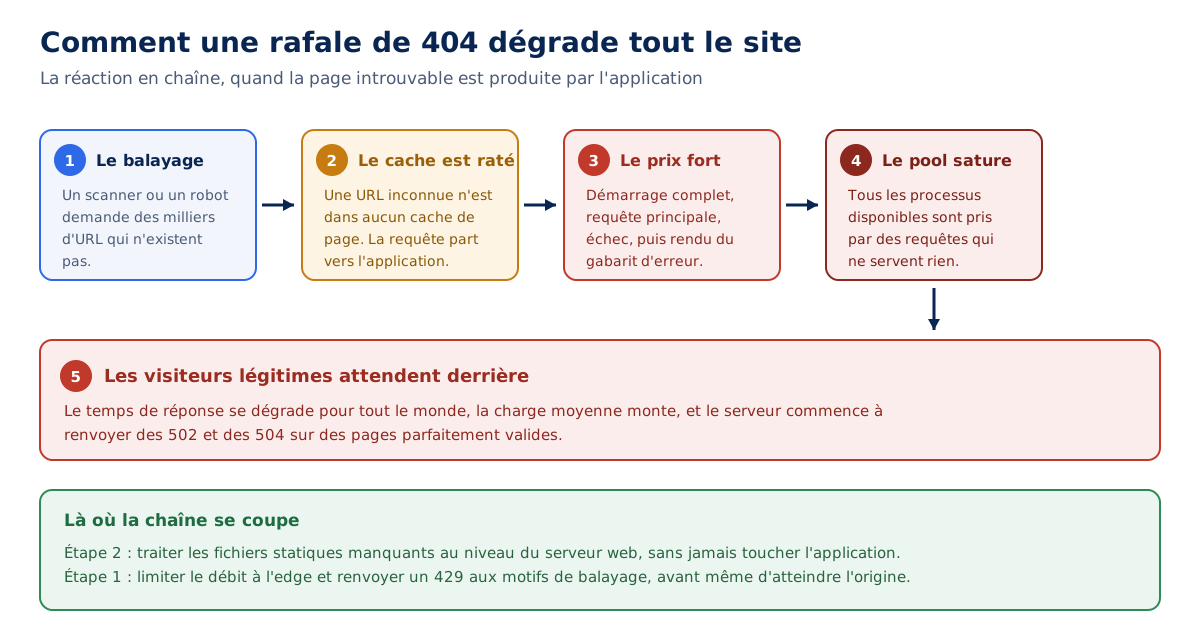
Four measures cut this chain at different points, and it is best to apply them together.
- Process 404s on static resources directly at the web server level, without ever reaching the application ;
- Cache the
404response itself for a short period, so that the same phantom URL is only calculated once ; - Limit the rate on known crawling patterns, and filter at the edge for paths that do not exist on the stack used ;
- Monitor the volume of 404s in server logs, distinguishing between those from real visitors and those from bots.
The first measure is implemented with a few lines of configuration, and it's the one with the most immediate effect. Nginx's try_files directive allows returning a plain 404 on static file extensions without ever calling PHP-FPM.
# Les fichiers statiques absents ne réveillent jamais l'application
location ~* \.(jpg|jpeg|png|webp|avif|svg|css|js|woff2)$ {
    try_files $uri =404;
    access_log off;
}

# Le routeur du CMS ne voit que les URL de pages
location / {
    try_files $uri $uri/ /index.php?$args;
}
This type of adjustment falls under server configuration as much as code, and that's one of the reasons why we treat hosting scaling as a performance lever in its own right rather than as simple support.
What is a soft 404 and why is it a problem ?
A soft 404 is a page that displays a not-found message while returning a 200 code. Google defines it exactly in these terms and recommends returning a real 404 for pages that do not exist. The problem is that a soft 404 is invisible without an audit : to the eye, the page appears correct.
The default is twofold, and that's what makes it particularly costly. On the server side, the page has been fully calculated and will be cached as valid content even though it contains nothing. On the search engine side, Google continues to crawl a URL it believes to be valid, which wastes crawl budget and can delay the discovery of pages that actually matter.
Mass redirects to the homepage produce the same effect. John Mueller explicitly classified them in this category: a deleted URL redirected to the homepage is not indexed anyway, and ends up being treated as a soft 404 in the long run.
403 Forbidden error: what are the causes of the http 403 code ?
The 403 Forbidden error code means that the server understood the request but refuses to fulfill it. The resource exists, access is simply prohibited. Unlike 401, no authentication will resolve the situation : the refusal is categorical, and RFC 9110 specifies that the server may even choose to return a 404 instead if it does not wish to reveal the existence of the resource.
For a user blocked by an HTTP 403 error on a site, the most frequent causes fall into three categories: a page reserved for logged-in members, an application firewall that deemed the request suspicious (VPN, browser extension, flagged IP address), or geographic restriction. Clearing the site's cookies, disabling a VPN, or trying from another connection resolves a good portion of cases.
On the operational side, the technical causes of an HTTP 403 error are more prosaic. Incorrect file permissions after a migration, a missing index file in a directory where listing is disabled, an overly broad security rule, or a security extension blocking a legitimate URL pattern.
One case deserves special attention for SEO. Google is very clear on this point: Googlebot never provides credentials, so a server that returns a 403 to it does so incorrectly, and the page will not be indexed. Search Console then reports these URLs under the explicit label Blocked due to access forbidden (403).
What do HTTP codes 400, 401, and other client errors mean?
The 400 Bad Request signals a request that the server cannot process because it is malformed: invalid syntax, corrupted header, unreadable request body, URL containing unencoded characters. It is a refusal to process, not a refusal of access, and it often occurs with poorly constructed API calls or cookies that have become too large.
The 401 Unauthorized has a misleading name: it actually means unauthenticated. The server requires identification and must accompany its response with a WWW-Authenticate header describing the expected method. The difference with 403 can be summed up in one sentence: with a 401, identifying yourself may resolve the situation; with a 403, it will not.
Other client errors are encountered mostly with APIs, and their proper use is what distinguishes a usable interface from a frustrating one.
405 Method Not Allowed: the resource exists but does not accept this method. APOSTon a page that only expects aGETis the canonical example;406 Not Acceptable: no format offered by the server matches what the client'sAcceptheader requests;408 Request Timeout: the client took too long to send its request, and the server closed the inactive connection;409 Conflict: the request conflicts with the current state of the resource, typically during two concurrent modifications ;415 Unsupported Media Type: the format of the submitted body is not supported, for example XML when the API expects JSON ;422 Unprocessable Content: the syntax is correct and the format is understood, but the content is semantically invalid. This is the code for a form validation that fails on the substance.
The most common confusion is between 400 and 422. The first indicates that the request is unreadable, the second that it is perfectly readable but what it asks for makes no sense. A malformed email address falls under 422, not 400 : the server understood perfectly what it was sent.
When should you use a 410 code instead of a 404 ?
The 410 Gone is used when the deletion is permanent and known as such. RFC 9110 describes it as the appropriate response when the server knows that the resource has been deliberately removed and that no replacement address exists. The 404, on the other hand, remains silent on permanence.
In terms of SEO, the practical difference is small but real. Google indicates that it treats 410 like 404 in its crawling documentation, while confirming that both these codes remove the URL from the index. John Mueller also settled the question of their impact on a site's perceived quality, in a response published on Reddit and reported in early 2026 :
404s and 410s are not a negative quality signal. This is how the web is supposed to work.
John Mueller, Search Advocate at Google, on Reddit, comments reported by Search Engine Roundtable on January 2, 2026
The real selection criterion is therefore elsewhere than in a supposed bonus for 410. Use a 410 for content deliberately removed without a successor, such as a filled job offer, a discontinued product, or a purged page ; keep 404 for everything else, and set up a 301 redirect as soon as a real equivalent exists.
The error to absolutely avoid is mass redirection to the homepage, which has none of the merits of the three previous options and additionally creates serial soft 404s.
What is the purpose of the 429 code and how does it protect a server ?
The 429 Too Many Requests, defined by RFC 6585 in April 2012, indicates that a client has sent too many requests in a given period. It is the only code in the 4xx family that actively protects the infrastructure instead of indicating failure : it prevents the saturation described above by refusing excessive traffic before it consumes resources.
Its effectiveness depends entirely on where it is generated. A 429 served by the application protects nothing, since the cost of application startup has already been paid by the time the decision is made. It must therefore be issued as early as possible, at the edge or at the web server level, where refusal costs almost nothing.
# Nginx : 10 requêtes par seconde et par IP, avec une file de 20
limit_req_zone $binary_remote_addr zone=general:10m rate=10r/s;
limit_req_status 429;

location / {
    limit_req zone=general burst=20 nodelay;
    try_files $uri $uri/ /index.php?$args;
}
The 429 must always be accompanied by a Retry-After header indicating the delay before retrying, expressed in seconds or as a date. Without it, a well-behaved client has no way of knowing when to return, and a legitimate bot risks giving up permanently.
A point of caution deserves to be highlighted because it is often misunderstood. Google treats 429 as a server overload signal, just like a 5xx error, and slows down its crawling accordingly. Its documentation adds an explicit instruction: never use a 401 or 403 to limit crawling rate, as these codes have no effect on Googlebot's pace and instead cause de-indexing.
Is your site as fast as your visitors expect?

500 Error: What does this error code mean and how to fix it?
The 500 Internal Server Error HTTP error is the generic response of a server that has encountered an unexpected condition and does not know how to qualify it more precisely. The request was valid, the application started, it began to execute, and then it failed along the way. It is the most searched-for code of all, and also the least informative by design.
For a visitor encountering a 500 error on a third-party site, there is strictly nothing to do: the problem is entirely on the server side. Refreshing the page a few minutes later remains the only reasonable option, and the error disappears on its own if the incident was temporary.
In terms of cost, 500 is particularly unrewarding. The entire chain has been mobilized, application startup, database connection, code execution, and the result is zero. The server additionally pays for writing to error logs, which, under massive incident, adds disk write load to an already struggling system.
How to fix a 500 error?
The code itself says nothing about the cause, and it is precisely for this reason that the error log is the only valid starting point. On a PHP stack, the trace is found in the web server log, in the PHP-FPM log, and often in an application-specific debug file. The message found there, however, is explicit.
# Les dernières erreurs applicatives, en temps réel
tail -f /var/log/nginx/error.log
tail -f /var/log/php8.3-fpm.log

# Sur WordPress, activer la journalisation dans wp-config.php
define('WP_DEBUG', true);
define('WP_DEBUG_LOG', true);
define('WP_DEBUG_DISPLAY', false);
The most frequent causes on a WordPress site are a plugin conflict after an update, a PHP memory limit reached, a syntax error in a theme file, a corrupted .htaccess file, or an unreachable database. The official WordPress documentation details the mass deactivation procedure for plugins, which isolates the culprit in minutes.
What is the difference between a 502 error and a 504 error ?
The 502 Bad Gateway means that a server acting as a gateway received an invalid response from the upstream server. The 504 Gateway Timeout means that this same upstream server did not respond at all within the allotted time. The 502 indicates a broken response, the 504 an absence of response, and this nuance directly guides the diagnosis.
In a classic Nginx plus PHP-FPM stack, the operational translation is very concrete. An exhausted PHP process pool, or a process crashing during execution, typically manifests as 502 errors. A process exceeding the maximum duration, such as a large import or an unoptimized SQL query, produces 504 errors. These are the two codes that most directly indicate excessive load.
The parameters to examine are few and can be read in a few minutes. The maximum number of child processes in the PHP pool, the allowed execution time, and the web server's timeouts to its backend form the decisive trio.
# PHP-FPM : le pool trop petit produit des 502 sous charge
pm.max_children = 24
request_terminate_timeout = 60s

# Nginx : au-delà de ce délai, le client reçoit un 504
fastcgi_read_timeout 60s;
Increasing these values without changing anything else often amounts to moving the problem, exchanging quick 502s for slow 504s. The useful work consists first of reducing what each request costs, which brings us back to the first response time and what constitutes it.
503 error: what does service temporarily unavailable mean ?
The 503 Service Unavailable indicates that the server is momentarily unable to process the request, due to overload or scheduled maintenance. RFC 9110 insists on a point that almost no one applies: this condition is presumed to be temporary, and the server should indicate via a Retry-After header when to try again.
This is the only correct code for maintenance. Served with its Retry-After, it tells search engines to come back later and preserves existing indexing. Maintenance served with a 200 and a nice waiting page is much more dangerous: Google then indexes this waiting page instead of the actual content, potentially across thousands of URLs.
<?php
// Maintenance correcte : code 503 et délai de retour explicite
http_response_code(503);
header('Retry-After: 3600');
header('Content-Type: text/html; charset=UTF-8');
echo '<h1>Maintenance en cours</h1><p>Retour prévu dans une heure.</p>';
exit;
Duration remains the determining factor. Google has long recommended this mechanism for planned interruptions, but a 503 that lasts for several days eventually leads to the removal of URLs from the index. A few hours cost nothing, several days cost SEO.
What does a 499 code mean in Nginx logs?
The 499 does not belong to any standard: it is not in the IANA registry, and it is specific to Nginx, which defines it in its source code as NGX_HTTP_CLIENT_CLOSED_REQUEST. It means that the client closed the connection before the server responded. No error occurred on the server side; no one was waiting for the response anymore.
This code therefore never appears in a browser, only in access logs. And that's where it becomes valuable, because it indirectly measures something that no other code indicates: the actual patience of clients facing backend slowness.
A rising proportion of 499s almost always signals a backend that is too slow, with visitors closing the tab or bots giving up before completion. It is a performance indicator disguised as an error code, and its evolution over time should be monitored as a metric in its own right. Counting it in logs requires just one line.
# Répartition des codes de statut sur les 100 000 dernières requêtes
tail -n 100000 /var/log/nginx/access.log \
  | awk '{print $9}' | sort | uniq -c | sort -rn
What is the impact of status codes on SEO?
Each code family produces a distinct effect on indexing, and Google's crawling documentation, updated on February 4, 2026, details this code by code. The most consequential point concerns 5xx errors: when server errors increase, Google's bots temporarily slow down their crawling, and the decrease is proportional to the number of affected URLs.
This slowdown does not correct itself instantly. Google specifies that the crawling rate gradually increases once the server starts responding with 2xx again, which means that an incident lasting a few hours has a visibility cost that extends well beyond its resolution. Already indexed URLs are kept for a while, then eventually removed if errors persist.
Other families are read more simply. The 4xx codes, with the notable exception of 429, have no effect on the crawl rate: the URLs concerned leave the index and are crawled less and less often, without the rest of the site suffering. Redirects pass on the canonicalization signal, strong for 301, weak for 302.
Where to see the error codes encountered by Google?
Google reports everything it encounters during crawling in Search Console, under the Pages tab, in the Why pages aren’t indexed section. This table lists the reasons for non-indexing, with the number of URLs concerned by each and the site's history with this problem, and clicking on a row provides examples of affected URLs.
The labels here are directly translated from the status codes, making it the primary dashboard. You'll find Server error (5xx), Redirect error, Soft 404 error, Not found (404), Blocked due to access denied (403), Blocked due to unauthorized request (401), and a generic entry for other 4xx errors.
One line deserves special attention because it directly links SEO to server health: Detected, currently not indexed. Search Console documentation explains that Google wanted to crawl these URLs but deferred crawling because the site risked being overloaded. Seeing this line grow is a signal that a performance issue is costing indexation.
The Crawl Stats report, accessible from the property settings, usefully complements the reading with the distribution of response codes over time and the host's status. This is where you can read the correlation between a spike in 5xx and the subsequent drop in crawl requests, a connection we systematically document when we analyze the link between technical performance and visibility.
The reference table of HTTP status codes
Here are the codes we actually encounter on the web, with for each what it costs and the action it calls for. The cost columns are what distinguish this table from usual definition lists.
| Code | Label | What it means | What it costs | What to do |
|---|---|---|---|---|
| 100 | Continue | The server agrees to receive the rest of the request | Negligible | Nothing, internal mechanism |
| 101 | Switching Protocols | Switching to another protocol, typically WebSocket | Negligible | Nothing |
| 103 | Early Hints | Critical resources announced before the final response | Net gain on high TTFB | Enable if the server allows it |
200 | OK | Success, the content is in the response | The most expensive in the family: the entire body is transferred | Nothing, it's the target |
| 201 | Created | A resource was created | Normal application cost | Return the Location header |
| 202 | Accepted | Request accepted, processing deferred | Low on emission | Plan for status tracking |
204 | No Content | Success without response body | Very low: no useful bytes | Reserved for calls without return |
| 206 | Partial Content | Resource fragment, response to a Range | Proportional to the fragment | Nothing, expected on media |
| 301 | Moved Permanently | Permanent move | A full network round trip, cached durably | Place at server level, never in a chain |
| 302 | Found | Temporary detour | A full network round trip | Prefer over 301 as long as nothing is certain |
| 303 | See Other | Redirect in GET after a submission | A full network round trip | Use after a form POST |
| 304 | Not Modified | The client's copy is still valid | A round trip, almost zero bytes | Make it useless with a long and immutable cache |
| 307 | Temporary Redirect | Like 302, method preserved | A full network round trip | Required if a POST is redirected |
| 308 | Permanent Redirect | Like 301, method preserved | A full network round trip | Required if a POST is redirected |
| 400 | Bad Request | Malformed request | Low if rejected early | Validate upstream, not in the controller |
| 401 | Unauthorized | Authentication required | Low | Never use it against bots |
| 403 | Forbidden | Access denied, permanently | Almost zero at the edge, high in the application | Filter as early as possible, never against Googlebot |
| 404 | Not Found | Resource not found | Often the most expensive request on the site | Process static files at the web server, cache them |
405 | Method Not Allowed | HTTP method not accepted | Low | Return the Allow header |
406 | Not Acceptable | No format suits the client | Low | Soften content negotiation |
| 408 | Request Timeout | The client took too long to send | A connection tied up for nothing | Adjust inactivity periods |
| 409 | Conflict | Conflict with the current state of the resource | Normal application cost | Explain the conflict in the body |
| 410 | Gone | Voluntary and permanent deletion | Identical to 404 | Reserved for assumed withdrawals without successors |
| 415 | Unsupported Media Type | Body format not supported | Low | Document accepted formats |
| 422 | Unprocessable Content | Correct syntax, invalid content | Validation cost | Detail the fields in error |
429 | Too Many Requests | Too many requests in the period | Net savings: it avoids saturation | Serve at the edge, always with Retry-After |
| 499 | Client Closed Request | The client left before the response (Nginx) | Server work is lost | Monitor the share: it's a sign of slowness |
| 500 | Internal Server Error | Unqualified application failure | The entire stack paid for a failure | Read the error log, nothing else |
502 | Bad Gateway | Invalid response from upstream server | Symptom of a saturated pool | Dimension the pool, lighten the requests |
| 503 | Service Unavailable | Temporary unavailability or maintenance | Low, but costly in visibility if prolonged | Always accompany with a Retry-After |
| 504 | Gateway Timeout | The upstream server did not respond in time | Symptom of processing too long | Optimize the request before extending the timeout |
A cross-sectional reading of this table reveals a clear pattern. The most costly codes are not the most spectacular errors, but banal responses produced at the wrong level: an application 404, a redirect set by an extension, a 304 calculated by the CMS. None of these three cases appear in an error report.
The second reading concerns the action columns: half of the recommendations boil down to the same instruction, serve the response as early as possible. This is what makes an inventory of a site's status codes as instructive as a load profile.
How to analyze status codes in server logs?
Web server access logs are the only source that sees all traffic, including bots, whereas browser-side measurement tools only see visitors who have executed JavaScript. It is therefore there, and nowhere else, that the real volume of 404s, the proportion of 499s, and the peaks of 5xx correlated with load are read.
Four requests are enough to provide an actionable overview in a few minutes. The first gives the overall distribution, the second identifies the most requested ghost URLs, the third isolates server errors, the fourth reveals who is triggering these requests.
# Les 30 URL en 404 les plus demandées
awk '$9 == 404 {print $7}' access.log | sort | uniq -c | sort -rn | head -30

# Les erreurs serveur des dernières heures, avec leur URL
awk '$9 ~ /^5/ {print $9, $7}' access.log | sort | uniq -c | sort -rn | head -20

# Qui génère les 404 : visiteurs ou robots ?
awk '$9 == 404' access.log | grep -o 'bot\|crawler\|spider' | sort | uniq -c
The Search Console's Crawl Stats report provides the complementary perspective, that of Google, with the distribution of response codes and host status over ninety days. A crawler completes the system by revealing what no log shows: internal redirect chains and soft 404s, which by definition respond with 200 and therefore go unnoticed in the logs.
These three sources only partially overlap, and it is precisely their cross-referencing that is instructive. The vocabulary used by each of them can also be found in our glossary of web performance terms, for those who are new to these reports.
A status code is an architectural decision
Most sites choose their status codes without realizing it. No one decided that 404s would be handled by the CMS router, that redirects would be set by an extension, or that maintenance would be displayed with a 200. These choices were made by default, through installations and migrations, and they continue to have a cost with every request without ever appearing in a performance report.
What makes the subject interesting is that it breaks down the usual barrier between SEO and infrastructure. The same setting, the place where a 404 is generated, simultaneously determines server load, consumed crawl budget, and what Search Console will display in three weeks. Few technical levers have this cross-functional impact for such a modest effort.
This leaves the question that these three numbers implicitly pose to any technical team: who in the organization owns this decision? The developer writing the router, the system administrator configuring Nginx, and the SEO manager reading Search Console all look at the same status code from three different perspectives, and none of the three sees the whole picture. Sites that handle their status codes well are often, quite simply, those where these three people talk to each other.