A CRO team launches a test on the homepage. The variation gains two conversion points, everyone celebrates. Three weeks later, the Search Console's Core Web Vitals report turns orange: mobile LCP has increased from 2.1 to 3.4 seconds, and no one makes the connection. The culprit is not the test itself, but the mechanism that makes it possible, the one that hides the page while the tool decides what to display.
This mechanism has a name, anti-flicker, or pre-hiding. It consists of making the page invisible from the beginning of the load, until the A/B testing script loads, randomly selects a variation, and modifies the DOM, and then removing the veil. Without it, the visitor would see the original for a few tens of milliseconds before the variation, which is jargon for flash of original content. With it, the browser paints nothing until the decision is made, and the LCP mechanically pays the price.
This article establishes exactly where this delay comes from, why it appears in almost no tool rankings, and why default publisher settings make it much heavier than it should be. It also shows that the question is never anti-flicker yes or no, but within what scope, for how long, for which tests. How many milliseconds does your A/B testing tool actually cost you, and which ones are avoidable?
Why does an A/B testing tool slow down page display?
Because it hides the page while it decides what to display. To prevent the visitor from seeing the original before the variation, the tool applies a rule like body { opacity: 0 } from the beginning of the load, and only removes it once the decision is made. Adobe Target, Optimizely, and Wingify set this wait time between 2,000 and 3,000 ms by default, and this hiding delays the display of all content.
The problem that anti-flicker solves
A client-side A/B test works by substitution: the server always sends the same page, and it's a script in the browser that replaces a title, an image, or a button with the variant. Between the moment the HTML is displayed and the moment the script finishes its work, there is a window during which the visitor sees the original. This window is the flicker. It's not only visually unpleasant, it distorts the experience itself: part of the test group saw the control, and their behavior is no longer attributable to the variant alone.
Anti-flicker is therefore not an editor's whim. Kameleoon's documentation summarizes the market's position by stating that flicker can confuse visitors and significantly skew test results. It is the condition for the validity of the experience, and everything that follows starts from this observation rather than contesting it.
The solution adopted by the market
The almost unanimous response from editors is to hide the entire page until the decision is made. A small synchronous script, placed at the beginning of the <head>, injects a stylesheet that makes the <body> invisible, then arms a security timer. The snippet below shows the generic form, commented to highlight the three moments that matter: the placement, the wait, and the removal:
<script>
(function (d, css, delay) {
  // 1. Pose du masque : une feuille de style injectee avant tout rendu
  var s = d.createElement('style');
  s.id = 'ab-mask';
  s.textContent = css;
  d.head.appendChild(s);

  // 3. Levee du masque : appelee par l'outil des que la variante est appliquee
  var lift = function () {
    var n = d.getElementById('ab-mask');
    if (n) { n.parentNode.removeChild(n); }
  };
  window.__abLift = lift;

  // 2. Attente bornee : le filet de securite si l'outil ne repond pas
  setTimeout(lift, delay);
})(document, 'body { opacity: 0 !important }', 3000);
</script>
This script must be synchronous and placed before any other resource, which is the exact opposite of everything else we recommend to reduce the impact of third-party JavaScript on performance. The exception here is structural: a mask applied after the first render masks nothing. Optimizely even asks to place its snippet as the first script in the head, loaded blocking, and explicitly advises against async or defer loading because it significantly increases the risk of flicker. Blocking is the nominal behavior, not an integration error.
What the visitor sees during this time
Nothing, or more precisely the page background. Resources are loaded, the DOM is built, the layout is calculated, but no content pixels are displayed. Adobe specifies in its documentation that the browser continues to render the page and load CSS and images under an opacity: 0. The work is done, it's simply hidden. On mobile and on an average network, this wait adds to all the others: to the TTFB, to the download of fonts, to the decoding of the main image. And this is precisely where LCP measurement comes in.
How does anti-flicker degrade LCP?
Directly proportionally. An element whose opacity is zero is explicitly excluded from LCP candidates by Chrome, since an August 2020 change: as long as the mask is in place, the browser retains no candidate. Three hundred milliseconds of pre-masking therefore add three hundred milliseconds to the LCP, without damping, regardless of the rest of the page's speed.
An invisible element is not a candidate
The definition of Largest Contentful Paint on web.dev is unambiguous: Chromium browsers exclude elements with zero opacity from candidates, because they are invisible to the user, and an element cannot be considered the largest content element until it is rendered and visible. The consequence is more significant than a simple slowdown. The LCP timer does not start later: it has been running since navigation, but it simply finds nothing to measure until the veil is lifted.
The reasoning also applies to visibility: hidden, the other rule used by some publishers, including Optimizely in its non-blocking snippet. An element with hidden visibility occupies its place in the layout but is not painted, and an element that is not painted is not visible to the user. In both cases, the first LCP candidate appears when the mask is lifted, never before. The difference between the two properties lies elsewhere, in animations and events, not in the metric.
A linear relationship, without damping
Many performance costs partially overlap: a slow font and a slow image load in parallel, and removing one does not save all its time. Pre-masking escapes this rule. It applies after everything else, on the only path leading to display, and it is fully added to the LCP. If your main image is ready at 1.8 seconds and the mask drops at 2.1 seconds, the measured LCP is 2.1, period. The timeline below superimposes the two scenarios on the same page.
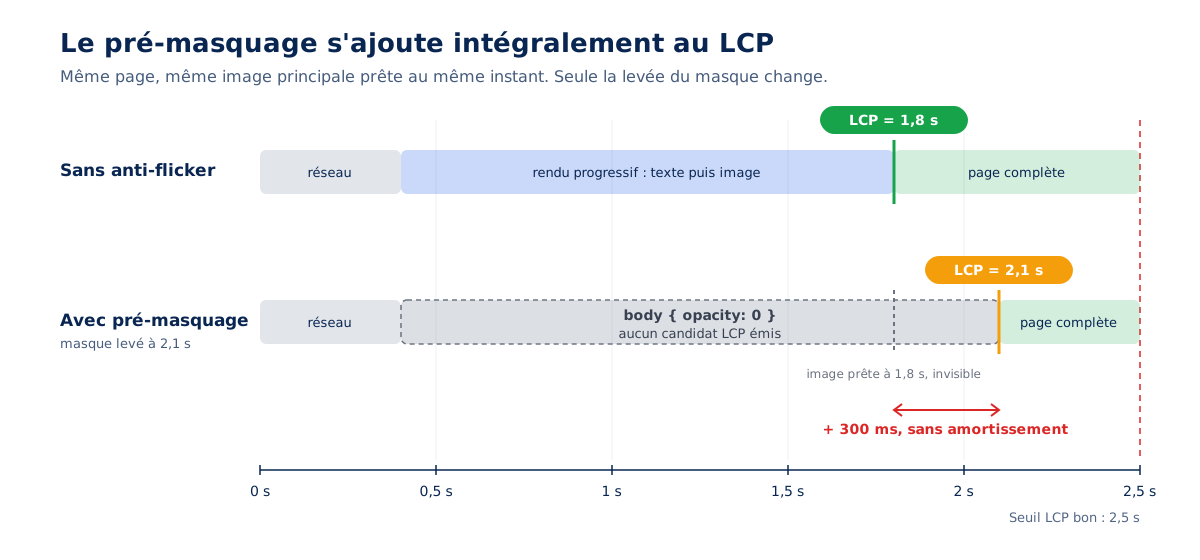
A less known consequence is worth noting. The browser stops emitting new LCP candidates as soon as the user interacts with the page, by a tap, a scroll, or a key press, as indicated on the same web.dev page. An impatient visitor who scrolls an empty screen during masking freezes the measurement before a candidate even exists. Depending on the tools, this visit then appears without an LCP or with an outlier value, which explains some of the discrepancies between your RUM and CrUX data.
Partial masking is a false good idea
All editors offer to restrict the mask to a container rather than the entire <body>. Adobe documents replacing body {opacity: 0 !important} with #container-1, #container-2 {opacity: 0 !important}, and Optimizely's non-blocking library accepts a list of selectors. The gain is only real if the LCP element is outside the masked area. However, in e-commerce as in publishing, the tested visual is precisely the LCP element: the hero, the product photo, the main title. Masking only this block amounts to masking exactly what the metric expects.
A field trap is added to this limitation. The snippet provided by default sometimes targets a selector that does not exist on the page, following a redesign or a theme change. The team believes they are protected from flicker when the masking applies to nothing, and the test runs with a bias that no one sees. The only reliable check is to read the CSS rule actually applied in the browser, which the last part of this article details.
The second masking you didn't see
At Adobe, two mechanisms coexist. The pre-masking snippet for the <head>, recommended when at.js is loaded asynchronously, applies body {opacity: 0 !important} for 3,000 ms. But the at.js library includes its own internal masking, controlled by the bodyHidingEnabled setting, true by default, which sets the <body> to zero opacity as soon as it executes and until the Target server responds. Removing the snippet is therefore not enough: the library's masking must be explicitly disabled, and before it loads.
<script>
// A placer AVANT le chargement d'at.js
window.targetGlobalSettings = {
  // Masquage interne de la bibliotheque : true par defaut.
  // Le snippet de pre-masquage du head est un second mecanisme, independant.
  bodyHidingEnabled: false,

  // Ou, pour le conserver mais le restreindre au bloc teste :
  // bodyHiddenStyle: '#hero {opacity: 0 !important}'
};
</script>
The same principle exists at Wingify, formerly VWO, whose asynchronous SmartCode masks the <body> by default via the hide_element variable, and at Kameleoon, whose installation tag carries its own blocking rule. In each case, the mask belongs to the tool, not your page, and disabling it requires configuring the tool. It remains to measure what all this costs on the three Core Web Vitals.
What is the real effect on Core Web Vitals?
LCP absorbs the entire duration of the mask, CLS absorbs the cost of the inverse solution, and INP pays a permanent presence cost. On a page whose main image is ready at 1.8 seconds, a 600 ms mask is enough to exceed the 2.5-second threshold set by Google, and to move the URL into the "to improve" category of Search Console.
LCP, the most affected
The mechanism was described above, what remains is the order of magnitude. Kameleoon announces that it lifts its rule in less than 50 ms once its script is loaded, which is the favorable case : a 29 KB file, compressed, served from a CDN, on a good connection. The unfavorable case is the mobile visitor on a degraded network, for whom the download alone can exceed the safety delay, and who then waits for the entire timeout.
Our guide on LCP and how to optimize it details the four sub-parts of the metric, from TTFB to rendering delay. Pre-masking is added to the last one, the one that image and server optimizations never touch : you can have a perfectly preloaded image and a poor LCP, simply because the veil falls late.
CLS, the cost of the inverse solution
Disabling the mask moves the problem without solving it. Without pre-masking, the variant replaces the content after display, and this replacement produces a layout shift as soon as the variant does not have the exact dimensions of the original. The documentation for Cumulative Layout Shift specifies a point that almost everyone misses: the `hadRecentInput` exemption only covers the 500 milliseconds following a discrete event, tap, click, or key press, and scrolling is not part of it. A shift produced while the visitor is scrolling the page is therefore counted in full.
The case is frequent on mobile, where the visitor starts scrolling before the loading is finished. A test that inserts a reassurance banner below the hero, or that lengthens a button, then triggers a shift that is both visible and counted. Our article on CLS and how to optimize it explains how to reserve space in advance; for an A/B test, this means designing the variant with equal dimensions, which is not always compatible with what you want to test.
INP, the cost of presence
A/B testing tools don't just wait. To apply a variant to an element that doesn't exist yet, they monitor the DOM. Adobe exposes a setting `selectorsPollingTimeout` to 5,000 ms, the duration for which at.js queries the page for the experience selectors. Kameleoon describes an engine that captures DOM events in real time. This work runs on the main thread, and it falls within the INP measurement window with each interaction that coincides with it.
Our guide to INP and how to optimize it explains why mutation observers are among the prime suspects for slow interaction : each DOM change caused by a click wakes up the observer, which re-evaluates its selectors before the browser can paint the response.
The important point is that this cost is paid even without an active test. The script loads, initializes, sets its cookies and local storage, sets up its monitoring, then finds that no campaign is targeting this page. AB Tasty also indicates that its tag weighs 35 KB empty, before any campaign, and considers that beyond 125 KB it becomes too heavy for good performance. The cost of presence is continuous, independent of the number of tests, even months after the end of the last campaign.
What your Lighthouse audit won't show
Two blind spots make this subject difficult to diagnose with the usual tools. The first is due to the nature of INP : it is a field metric, which requires real interactions, and a lab audit does not produce it. Lighthouse relies on Total Blocking Time as an approximation, which captures long loading tasks but not the cost of an observer waking up at the moment of the click. The cost of presence is therefore invisible in a PageSpeed report, and you need RUM to see it.
The second blind spot is more subtle, and more useful. If your tool responds in 400 ms under normal conditions, reducing its timeout from 3,000 to 1,000 ms changes absolutely nothing in the nominal case, only in the 95th and 99th percentiles, i.e., for visitors for whom the tool did not respond in time. A lab measurement, on a stable simulated connection, will show no gain.
Yet the gain is real in field conditions, for the most disadvantaged visitors, those who weigh the most in the 75th percentile of CrUX. Our PageSpeed Insights vs. Lighthouse comparison revisits this difference between lab and field data : on this subject, only field data tells the truth.
What we find in the implementations we audit
The publishers' documentation describes a reference behavior. The code that actually runs on a production site often deviates from it, and it is in this deviation that the bulk of the cost is hidden. The findings that follow come from our performance audits on sites from various sectors ; they are anonymized, but each one is reproducible on your own site with the checks provided at the end of the article.
Masking is not always what is described
The literature talks about opacity: 0 on the <body>. On an educational services site, the tool was hiding the entire page with a rule * { visibility: hidden !important; }, applied to every element of the document and injected synchronously into the <head>, with a one-second safety delay. The observed effect impacted FCP, LCP, Speed Index, and INP simultaneously.
The principle remains the same, nothing is painted so nothing is a candidate, but the implementation varies from one publisher to another and from one version to another. The universal selector also has its own cost: it applies to every node in the document, and removing it forces a style recalculation on the entire tree. This is why you should read your own site's code rather than relying on documentation.
A permanent cost for intermittent use
This is the most common observation, and the easiest to fix. On a furniture e-commerce site, the testing tool was loaded on the entire site, very early in the page, and appeared in the audit as one of the primary generators of Blocking Time and long tasks, even though no campaigns were running on the majority of templates. The recommendation made is simple: only activate the tool on the pages and during the periods when a test is running, and never during peak commercial periods, where every millisecond of LCP is paid for in revenue.
What the script really does, line by line
On a network of comparison sites, a detailed script analysis of a market tool revealed an active waiting loop querying a library loading flag every 100ms, consuming several hundred milliseconds of processor time doing nothing. Added to this were massive shuffling of cookies and local storage, a JSON.parse called twice to read a single field, and collection requests issued via new Image().src. None of these flaws are visible in the documentation, but all are visible in the Performance tab of DevTools.
The last point deserves explanation. An image requested by script is treated by the browser as an ordinary resource, with its DNS resolution, connection, and queue, whereas navigator.sendBeacon() or fetch() with keepalive run in the background and survive page closure. Multiplied by the number of events collected, this technique inherited from the 2000s occupies connections whose critical resources are needed during loading.
A detail from the same audit is worth a sidebar. The reporting mechanisms already in place on the site were rendered inoperable because the call went through an asynchronous integration tag specific to the publisher. The team had implemented the recommended solution, and the installation method advised by the tool was canceling it. Abandoning the tool for this scope resulted in a script five times lighter, the disappearance of anti-flicker styles, an LCP reduced by several hundred milliseconds, and an improved INP. This is not a conclusion to generalize, but the order of magnitude to be aware of.
Two tools for the same function
On an e-commerce cosmetics site, the stack included both an A/B testing tool and a personalization platform that already offered A/B testing. Experience and testing analysis tools are among the biggest contributors to Blocking Time because they record user actions and interact with page content. The recommendation was to remove the redundancy to fix degraded INP on both mobile and desktop, even before touching the rest of the stack.
Why can't we simply defer it
This point of doctrine governs everything else, and it often surprises technical teams. Unlike measurement scripts, which can be deferred after loading without issue, as we explain regarding the impact of Google Analytics, an A/B testing tool must be prioritized: deferring it guarantees flicker and ruins the validity of the test. Therefore, there is no solution through deferral.
The only real levers are scope restriction, duration restriction, server-side migration, or removal. Each has a cost, and none can be decided without knowing the actual cost of the tool in place. One must also know which of the market's tools is the most expensive, and public rankings are misleading on this point.
Which A/B testing tool is the fastest?
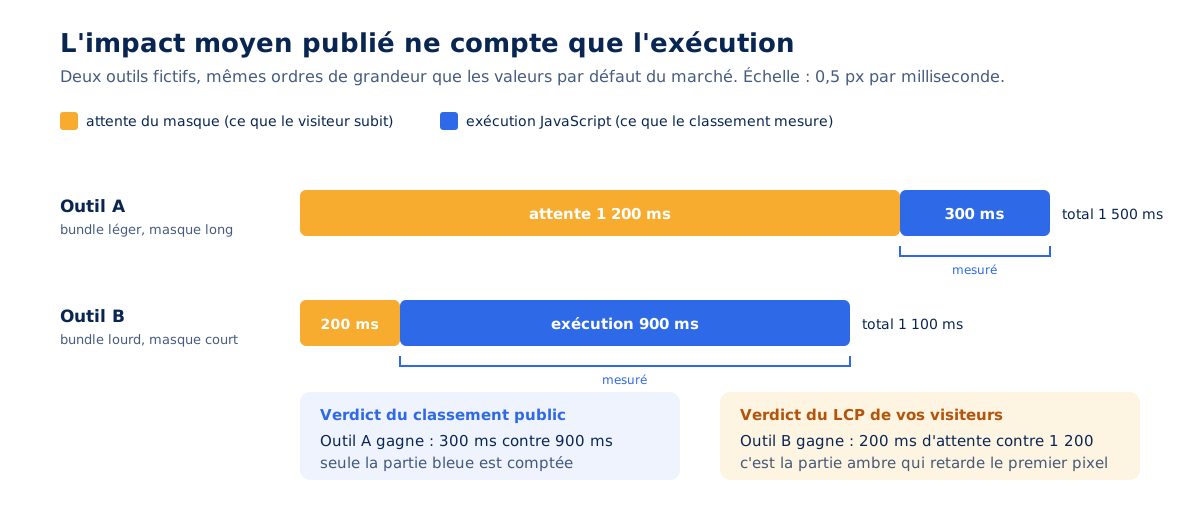
The question is poorly posed, and public rankings answer it poorly. The most cited indicator, the average impact of the third-party-web project, measures execution time on the main thread, from 307 ms for Monetate to 1,542 ms for Kameleoon, and ignores pre-masking wait time. A tool with a light bundle but aggressive masking appears excellent while severely degrading the LCP.
What public rankings measure
Patrick Hulce's third-party-web project aggregates Lighthouse audits from the HTTP Archive on approximately four million mobile sites each month, attributing to each third party the execution time of its scripts on the main thread. Testing tools are categorized as Analytics, lacking a dedicated category. In the dataset consulted on September 17, 2026, the five most represented publishers rank as follows, from lightest to heaviest, with the number of pages where each is detected:
- Monetate, 307 ms average impact on 2,490 pages ;
- VWO, 465 ms on 10,913 pages ;
- AB Tasty, 524 ms on 7,116 pages ;
- Optimizely, 898 ms on 25,015 pages ;
- Kameleoon, 1,542 ms on 3,585 pages.
These figures are accurate and useful, provided you know what they measure. This is the time the processor spends executing the publisher's scripts, as measured by Lighthouse's bootup-time audit, during a lab load without interaction. They say nothing about the time the page remained hidden, nor about what the script does when clicked. These are two different costs, and the latter does not appear in any public ranking.
Why this ranking might point to the wrong winner
Imagine two tools. The first executes 300 ms of JavaScript but hides the page for 1,200 ms, because its library is served from a slow origin and its security delay is long. The second executes 900 ms of JavaScript but reveals its mask in 200 ms. The ranking places the first far ahead, and your visitors' LCP says the exact opposite. The ranking measures what the tool makes the processor do, not what it makes the visitor wait for. The diagram below breaks down the bar into its two segments.
British consultant Andy Davies, one of the first to measure this mechanism on real sites with WebPageTest, drew a conclusion in 2020 that has not aged and that shifts the debate from anti-flicker to what it compensates for.
Fundamentally, the anti-flicker snippet is a symptom of a larger problem, and that problem is that testing tools finish their execution too late.
Andy Davies, web performance consultant, in his article The Case Against Anti-Flicker Snippets, published on November 16, 2020
He also points out an aggravation specific to Chrome, documented by Addy Osmani in his article on script loading priorities : an async script placed in the <head> is deprioritized and pushed to the second loading phase. An asynchronously loaded testing tool starts too late even before finishing too late, which explains why publishers recommending async need such a long mask. It's not the ranking you should read, it's the defaults.
Defaults, the true comparison criterion
The following table compares, for each publisher, what their official documentation states as of the writing date : the maximum default mask duration, the masked scope, and the presence of a second internal masking within the library. This is the table nobody publishes, and it's the one that allows you to choose.
| Publisher | Default safety delay | Masked scope | Second masking |
|---|---|---|---|
| Adobe Target | 3 000 ms (pre-masking snippet) | body, opacity: 0 | Yes, bodyHidingEnabled in at.js, enabled by default |
| Optimizely | 3 000 ms (maskTimeout, non-blocking snippet) | body, visibility: hidden | No, the nominal snippet is synchronous and blocking |
| Wingify (formerly VWO) | 2 000 ms then 2 500 ms (settings_tolerance, library_tolerance) | body via hide_element | Undocumented |
| Kameleoon | 1 000 ms (kameleoonLoadingTimeout) | Full page, blocking CSS rule | No, anti-flicker engine integrated into the script |
| AB Tasty | No page mask documented | None by default | No, the cost is in the tag weight |
Two readings are necessary. First, default delays range from one to three, from 1 000 to 3 000 ms, and Wingify actually combines two successive waits, one for settings and one for the library, totaling up to 4 500 ms in the worst case. Second, Kameleoon documents that its timeout is reached by 2 to 3% of visitors under normal conditions: relative to the 75th percentile of CrUX, this is not negligible, but it is the only default value compatible with an LCP under 2.5 seconds without reconfiguration.
One last point of vocabulary, to avoid sounding dated. AB Tasty and VWO announced their merger on January 20, 2026, under the auspices of the Everstone Capital fund, and on September 16, 2026, the unified brand Wingify was unveiled. VWO documentation has migrated to help.wingify.com, and the historical JavaScript variables, settings_tolerance and hide_element, remain documented there identically. The two products still coexist technically, with two tags and two distinct anti-flicker behaviors.
Is your site as fast as your visitors expect?

How to reduce cost without breaking tests ?
Rarely by disabling anti-flicker, and never without measuring what you're trading off. Without pre-masking, the cost shifts from LCP to CLS, as the variant replaces content after rendering, and test validity degrades. The three levers that work are scope, delay, and cleanup, and Optimizely itself reminds us that flicker only concerns visual tests above the fold.
Restrict the scope rather than remove it
The decision criterion is formulated by a vendor, and it's clear. Optimizely writes in its documentation that flicker is only a problem for visual experiences visible on load, and explicitly cites tests below the fold, those triggered by a visitor action, and tunnel deployments for measurement purposes as cases where masking is unnecessary. A price test, a button label at the bottom of the page, or cart logic therefore does not require a veil over the entire document.
The operational rule follows. Mask the tested scope, never the document, and only mask the document for hero tests, thereby accepting their LCP cost for the duration of the test only. A hero test that lasts three weeks costs three weeks of degraded LCP; a global mask left in place all year costs all year for tests that don't need it.
Set the delay for what it is, a safety net
The timeout does not apply to the nominal case; it only applies to visits where the tool did not respond in time. Reducing it improves the distribution tail, not the median. The method is to note in your RUM the actual unmasking time at the 95th percentile, then set the delay slightly above it: a tool that responds in 400ms at the 95th percentile justifies a safety net of 600 or 800ms, not 3,000.
The following section groups the actual configuration keys for each vendor, as they appear in their documentation, so you can look them up in your own code.
/* Optimizely, snippet non bloquant (librairie officielle) */
var maskTimeout = 3000;            // defaut : 3000 ms

/* Wingify, ex-VWO, SmartCode asynchrone */
settings_tolerance = 2000,         // attente des reglages
library_tolerance  = 2500,         // attente de la bibliotheque
hide_element       = 'body';       // '' pour ne rien masquer

/* Adobe Target */
// snippet de pre-masquage du head : dernier argument = 3000 ms
window.targetGlobalSettings = {
  bodyHidingEnabled: true,         // masquage interne d'at.js
  bodyHiddenStyle: 'body {opacity: 0 !important}'
};

/* Kameleoon, tag d'installation */
var kameleoonLoadingTimeout = 1000; // defaut : 1000 ms
The consent trap
A very frequent and rarely diagnosed situation deserves a diagram. The pre-masking snippet executes unconditionally, as it is inline in the <head>, but the loading of the tool itself is conditioned on consent, via the tag manager or the CMP. For any visitor who refuses, or who is slow to respond, no decision ever arrives and the page remains masked until the security delay expires: up to three seconds of white screen for a feature that will not execute. Our guide to choosing the right CMP details the interplay between consent and third-party loading.
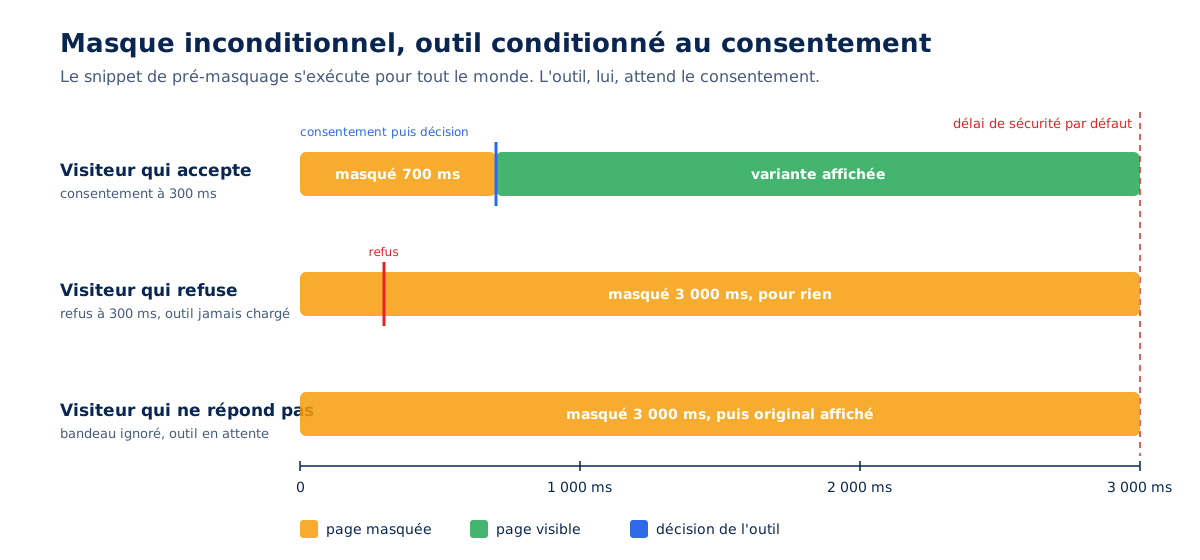
The fix is one line: condition the mask display on the same signal as the tool loading, or remove the mask as soon as the refusal is known. On a French site where the refusal rate commonly exceeds 30%, this means a third of visits pay the maximum price for a tool that doesn't run for them.
Clean up what is no longer needed
Two actions, the second of which is counter-intuitive. The first is to remove completed campaigns, which AB Tasty explicitly recommends by reminding that old campaigns add to the weight of current campaigns. The second concerns Optimizely, whose documentation specifies that archiving experiments does not reduce the snippet weight, because it is the pages and declared events that inflate it, not inactive experiments; each experiment is also capped at 1,048,572 bytes, or a little over a megabyte, which gives an idea of what a poorly maintained project can cause to be downloaded.
A textbook case, the test that counts phantom visitors
With Speculation Rules, a page prepared in the background is actually loaded and its JavaScript actually executed, as explained by the Chrome documentation on prerendering, which specifies that Google Analytics by default delays its measurement until activation, but that not all providers do. An A/B testing tool that does not test document.prerendering then records an impression for a visitor who never saw the page.
It's no longer just performance that's at stake, it's the very validity of the test: visitors counted in a group without having been exposed dilute the measured effect, and the test wrongly concludes that a variant changes nothing. Our article on Speculation Rules and prerendering details the side effects of this technique, and this is one more. Faced with all these workarounds, one question comes up in every steering committee: why not do everything server-side?
Is server-side testing the solution?
Technically, yes: a server-side test directly sends the HTML of the variant, so no more pre-masking or post-display substitution, no LCP cost or CLS cost. The price is organizational: one deployment per variant, a dependency on the technical team for each test, and the loss of autonomy that has made client-side tools successful since 2013. It's an organizational trade-off as much as a performance one.
What server-side truly eliminates
When the decision is made before sending the response, the browser receives an already consistent page. There is nothing to hide, nothing to replace, and the test script is reduced to an event collection that can be deferred without damage. Adobe offers a hybrid mode, serverState, in which at.js applies server-side retrieved offers without any network calls and only pre-hides the affected elements. This is the right answer, and it must be said clearly: all that the anti-flicker costs disappears when the variant is decided upstream.
What it costs in return
Server-side moves the test from the browser to the application code. Each variant becomes a feature to develop, test, and deploy, with the associated release cycle. The CRO team loses the visual editor and the ability to launch a test within the day without a ticket. On a high-traffic site, where a hero test costs several hundred milliseconds of LCP for millions of visits, the calculation quickly shifts towards the server. On a more modest site, the velocity of tests is often worth the performance cost, provided you know it.
The edge is not a magical intermediate solution
Edge experimentation offers, on CDN workers, promise the best of both worlds: the decision made before the browser, without touching the application code. This works for redirects and simple HTML substitutions, and it is real progress for these cases.
For anything that requires knowing the visitor's state on the client side, or modifying a component rendered in JavaScript, decisions that cannot be made at the edge are grouped and injected into the <head> to be executed by the browser. This brings us back to the client-side model, with its costs, for a portion of the tests. The edge reduces the scope of the problem, it does not eliminate it, and it remains to be seen what to do on Monday morning.
What to do concretely on your own site?
Measure first, then arbitrate on three decisions: what scope to hide, for how long, for which tests. The measurement method is that of any third party: block the tool's domain, reload, note the difference in LCP and TBT. Lighthouse allows this from the command line, provided that you measure a page that actually carries an active test, otherwise the difference only reflects the cost of presence.
# Mesure de reference, outil actif
lighthouse https://www.exemple.fr/ --preset=desktop --output=json --output-path=./avec.json

# Meme page, domaine de l'outil bloque (adapter le motif a votre editeur)
lighthouse https://www.exemple.fr/ --preset=desktop --output=json --output-path=./sans.json \
  --blocked-url-patterns="*cdn.optimizely.com*" "*dev.visualwebsiteoptimizer.com*" "*tt.omtrdc.net*"

# Ecart LCP et TBT entre les deux rapports
jq '.audits["largest-contentful-paint"].numericValue, .audits["total-blocking-time"].numericValue' avec.json sans.json
The resulting figure transforms an opinion debate between the CRO team and the technical team into a documented arbitration. It remains incomplete, as a lab audit sees neither the INP nor the timeout distribution tail, which is why the second check is done in the browser, on the actual site. The block below, to be placed first in the <head> before the tool snippet, measures the effective mask duration and places it in the Performance Timeline, where your RUM can collect it :
<script>
// 1. Duree reelle du masque, mesuree dans le navigateur
performance.mark('mask-start');
new MutationObserver(function (m, obs) {
  var b = document.body;
  if (!b) { return; }
  var cs = getComputedStyle(b);
  if (cs.opacity !== '0' && cs.visibility !== 'hidden') {
    performance.mark('mask-end');
    performance.measure('anti-flicker', 'mask-start', 'mask-end');
    obs.disconnect();
  }
}).observe(document.documentElement, { childList: true, subtree: true, attributes: true });
</script>

// 2. Dans la console, une fois la page chargee : la regle de masquage et son origine
[...document.styleSheets].forEach(function (s) {
  try {
    [...s.cssRules].forEach(function (r) {
      if (/opacity\s*:\s*0|visibility\s*:\s*hidden/.test(r.cssText)) {
        console.log(r.cssText, '<-', s.ownerNode && s.ownerNode.id || s.href || 'inline');
      }
    });
  } catch (e) {}
});

// 3. Dans la console : les requetes de collecte emises par new Image()
performance.getEntriesByType('resource')
  .filter(function (e) { return e.initiatorType === 'img' && /collect|track|event|log/.test(e.name); })
  .forEach(function (e) { console.log(e.name, Math.round(e.duration) + ' ms'); });
The first measurement tells how long your visitors stare at a blank screen, and it is the only figure that allows you to set the safety delay. The second displays the CSS rule actually in effect and its origin, which resolves the issue of the phantom selector and the second masking in one line. The third identifies collection requests issued as images, which are distinguished by their initiatorType.
To identify an active waiting loop, the DevTools Performance tab is sufficient : an identical task that repeats at fixed intervals, every 100 ms, is a telltale sign.
What these measurements will not settle is the final decision, and it deserves to be made without a prosecutor. A test that gains two conversion points can perfectly justify three hundred milliseconds of LCP for three weeks; our article on the cost of a fast website reminds us that performance is an economic trade-off, not an end in itself.
What is never justified is paying this price without knowing it, paying it for completed campaigns, or making visitors who have refused consent pay it. Between the CRO defending its velocity and the developer defending its LCP, the measured figure is the only arbiter that takes no sides.
Instrumenting this cost, relating it to the conversion gain, and making an informed decision is precisely what a web performance audit produces; reconfiguring the tool, restricting it, or replacing it is then part of a performance optimization carried out with the CRO team rather than against it. The question is no longer anti-flicker yes or no, and it never was.