
"Web performance" is often also referred to by its contracted form "webperf". In English, we speak of WPO, for "Web Performance Optimization". As its name suggests, it aims to estimate the level of web performance. Not very clear for a novice, is it? To be precise, we are talking about technical performance (loading speed), not commercial performance (conversions, rpm, etc.). The two are very different but are sometimes confused.
What is web performance?
Web performance is the technical discipline that aims to ensure fast display and smooth navigation of web pages in browsers, both during loading and throughout use. It is measured by standardized metrics, including Google's Core Web Vitals, and is optimized at every stage of the chain, from the server to the browser.
If we were to give it a definition, web performance would thus be the "technical discipline aimed at ensuring fast display and good fluidity of web pages in browsers, during their loading and throughout their use". This is the definition we have adopted in our webperf glossary and which seems to us the most explicit and accessible for non-technical profiles.
What are the stakes of web performance?
There are four stakes for web performance: better user experience, therefore a better conversion rate; increased visibility in search results; reduced hosting and bandwidth costs; and a lighter environmental footprint. Let's look at what each of these concretely covers.
Better User Experience
Improving the speed of a site's pages means ensuring that a maximum of users can access them regardless of their access conditions (internet connection, terminal power, web browser, etc.). For the majority of visitors, this translates into reduced waiting time and better fluidity when consulting content pages or using online tools. User Experience is thus much more qualitative on a website optimized for web performance.
Multiple studies and concrete cases have demonstrated the positive impact of performance optimization on indicators such as conversion rate, bounce rate, or revenue. Amazon, a pioneer in the field, estimates, for example, that every 100-millisecond gain in loading time allows a 1% increase in revenue. Other cases highlighted by Yelp, Mozilla, and Walmart show even more spectacular gains. And this is without mentioning the impact related to increased loyalty, which other reports also highlight.
In the more specific context of AdWords campaigns (or others), landing page optimization can have a significant impact on return on investment. This can considerably reduce the acquisition costs of new customers and prospects.
Improve your visibility in Google
The second reason why web performance is popular is linked to its greatest ambassador: Google. To reduce its costs related to page indexing, the number 1 search engine encourages site publishers to improve their page loading times. The "crawl" phase, essential for updating the results pages for millions of daily queries, is thus less impactful for the American company, whose data centers have a major impact on the electricity bill.

Still on Google's side, fast sites also allow faster display of advertising spaces. However, Google's main business remains online advertising, via its leading platform Google Ads. These are the 2 reasons why Google encourages site publishers to improve their loading times through its dedicated tool: Search Console. The "Page Experience" section includes a "Core Web Vitals" component that has expanded significantly over the last 5 years.
Web performance is thus officially an SEO ranking criterion, even if its weight within the ranking algorithms remains obviously less than that of traditional factors such as authority linked to netlinking and content quality.
Reduce hosting costs
By reducing the number of http requests, the weight of static resources, and the need for costly server-side calculations (PHP script execution, SQL queries, etc.), web performance optimization allows server load to be reduced, sometimes very significantly.
This translates to increased speed, especially during peak loads and periods of high demand (like a TV spot). If the delta is significant, it can also be an opportunity to downgrade the server configuration by opting for less powerful hardware in terms of processor and RAM (see our vision of performant hosting).
For a high-traffic daily site hosted on a dedicated server or a large VPS, the difference in hosting costs can be really interesting, and alone justify a web performance optimization project.
Save the planet from global warming?
This third part remains a question because, as web performance specialists, we really want to believe it. A site whose loading times have been optimized will necessarily be lighter and consume fewer resources than a comparable classic site (both in terms of hosting and user). It will thus generate fewer greenhouse gas emissions, ensuring a lower carbon footprint. We know, however, that in the digital world as a whole, the web is only responsible for 1 to 2% of global emissions.
If we can contribute to making the web better, it is not our job as experts that will save the planet from irreversible global warming.
How is web performance measured?
Web performance is measured in two complementary ways: in the lab, with synthetic tools like Lighthouse or WebPageTest that replay a load under controlled conditions, and in the field, with Real User Monitoring tools that capture the experience of your real visitors. The two families never give the same figures, and that's normal.
As in any technical field, having performance indicators is essential to compare different sites or evolutions over time. Similar to the automotive world where a car's performance can be measured in torque, horsepower, maximum speed, or time to reach 0-100 km/h, there are dozens of ways to calculate the webperf level of a web page.
What are the most relevant indicators?
Four indicators are sufficient to qualify the performance of a page: TTFB, server response time; LCP, main content rendering; CLS, visual stability; and INP, interaction responsiveness. The last three form the Core Web Vitals, while TTFB conditions all the others.
TTFB: server response time
Some indicators have been used for as long as we've talked about web performance. This is the case for TTFB (acronym for Time to First Byte), which measures the time it takes for a complete round trip between the browser and the server hosting the visited site. Simple to calculate, it is ideal for addressing web performance issues related to hosting (data center too far away, inadequate processor or RAM sizing, lack of a caching system, poorly configured SQL databases...).
Speed Index: perceived speed
The other metric that has retained its full meaning over the years is the Speed Index, which measures the time it takes for the visible area of the page (often referred to as the viewport) to be fully loaded. To do this, it is necessary to capture video, which is both complex and costly to implement. This is why not all tools offer it, but also why the indicator can sometimes vary significantly depending on the measurement tool used.
What are the Core Web Vitals?
The Core Web Vitals are the three metrics by which Google evaluates a page's loading experience: LCP, which measures the loading of the main content, CLS, which measures visual stability, and INP, which measures responsiveness to interactions. A page is considered good when all three thresholds are met at the 75th percentile of visits.
| Metric | What it measures | Good | To improve | Poor |
|---|---|---|---|---|
| LCP | Loading of the main content | ≤ 2.5 s | 2.5 to 4 s | > 4 s |
| CLS | Visual stability of the page | ≤ 0.1 | 0.1 to 0.25 | > 0.25 |
| INP | Responsiveness to interactions | ≤ 200 ms | 200 to 500 ms | > 500 ms |
These thresholds, published by web.dev, are assessed at the 75th percentile of visits: a page is considered good when three out of four visitors stay below the target value. A good average is therefore not enough; what matters is the distribution tail, where slow connections and modest devices are found.
Google, again, introduced in 2020 a set of metrics called "Web Vitals", among which are 3 "Core Web Vitals" that have since become the standard. Each aims to estimate the performance level of a web page from a specific angle. Together, they are intended to provide a comprehensive view of a page's performance level, and even a site's when averages are calculated as Google does with its origin reports. Here are these 3 indicators:
LCP
Acronym for "Largest Contentful Paint," this performance indicator measures the time it takes for the main visible element of the page to load. This is often an image, but can also be headings or text blocks. A good LCP should be under 2.5 seconds, a topic to which we dedicate a complete LCP guide, and it should never exceed 4 seconds.
INP
Acronym for "Interaction to Next Paint," this performance indicator measures the time it takes for a page to become smoothly interactive. It is heavily impacted by JavaScript, and particularly by third-party scripts. To be considered good, it should be under 200 milliseconds. Above 500 milliseconds, it is considered poor. We detail the causes and fixes in our article on INP optimization.
CLS
Acronym for "Cumulative Layout Shift," this performance indicator measures a page's ability to provide an interface whose elements remain stable over time. No visual shift, vertical or horizontal, should occur during resource loading. We dedicate to this metric a guide to CLS optimization. It is measured without units, with thresholds of 0.1 to be good and 0.25 at maximum.
The 3 other metrics in the "Web Vitals" section are FCP (First Contentful Paint), which measures the time it takes for the first visible element of the page to load, TTI (Time to Interactive), which measures the time it takes for a page to become interactive for the user, and Speed Index, already presented previously.
Is your site as fast as your visitors expect?

What tools are used to measure web performance?
Measurement tools are divided into two families. Synthetic tools, PageSpeed Insights, Lighthouse, GTmetrix, and WebPageTest, replay a load in a controlled environment and are used for diagnostics. Real User Monitoring tools collect the actual experience of your visitors, and are used to measure progress.
There are 2 main families of tools that allow you to evaluate the performance level of a page or site: synthetic testing tools, which provide access to so-called "lab" data, and Real User Monitoring (RUM) tools, which provide access to field data, i.e., data observed by real users during their browsing sessions on the site in question. Their operation is very different, giving each its own advantages and disadvantages.
Synthetic measurement tools
There are dozens of tools dedicated to calculating web performance. Some are free, others are paid, but the majority are available in both free and paid versions, with limitations on features and/or test volumes. They all offer at least information on traditional metrics and Web Vitals. What sets them apart is their ability to provide relevant recommendations based on a more or less qualitative and up-to-date benchmark. Here is a selection of the most popular, keeping in mind that there are other equally relevant ones.
PageSpeed Insights
This is the most popular tool, which many mistakenly believe is what Google takes into account in its algorithm. Very easy to use, it provides fairly basic recommendations to improve the average score, calculated on a basis of 100.
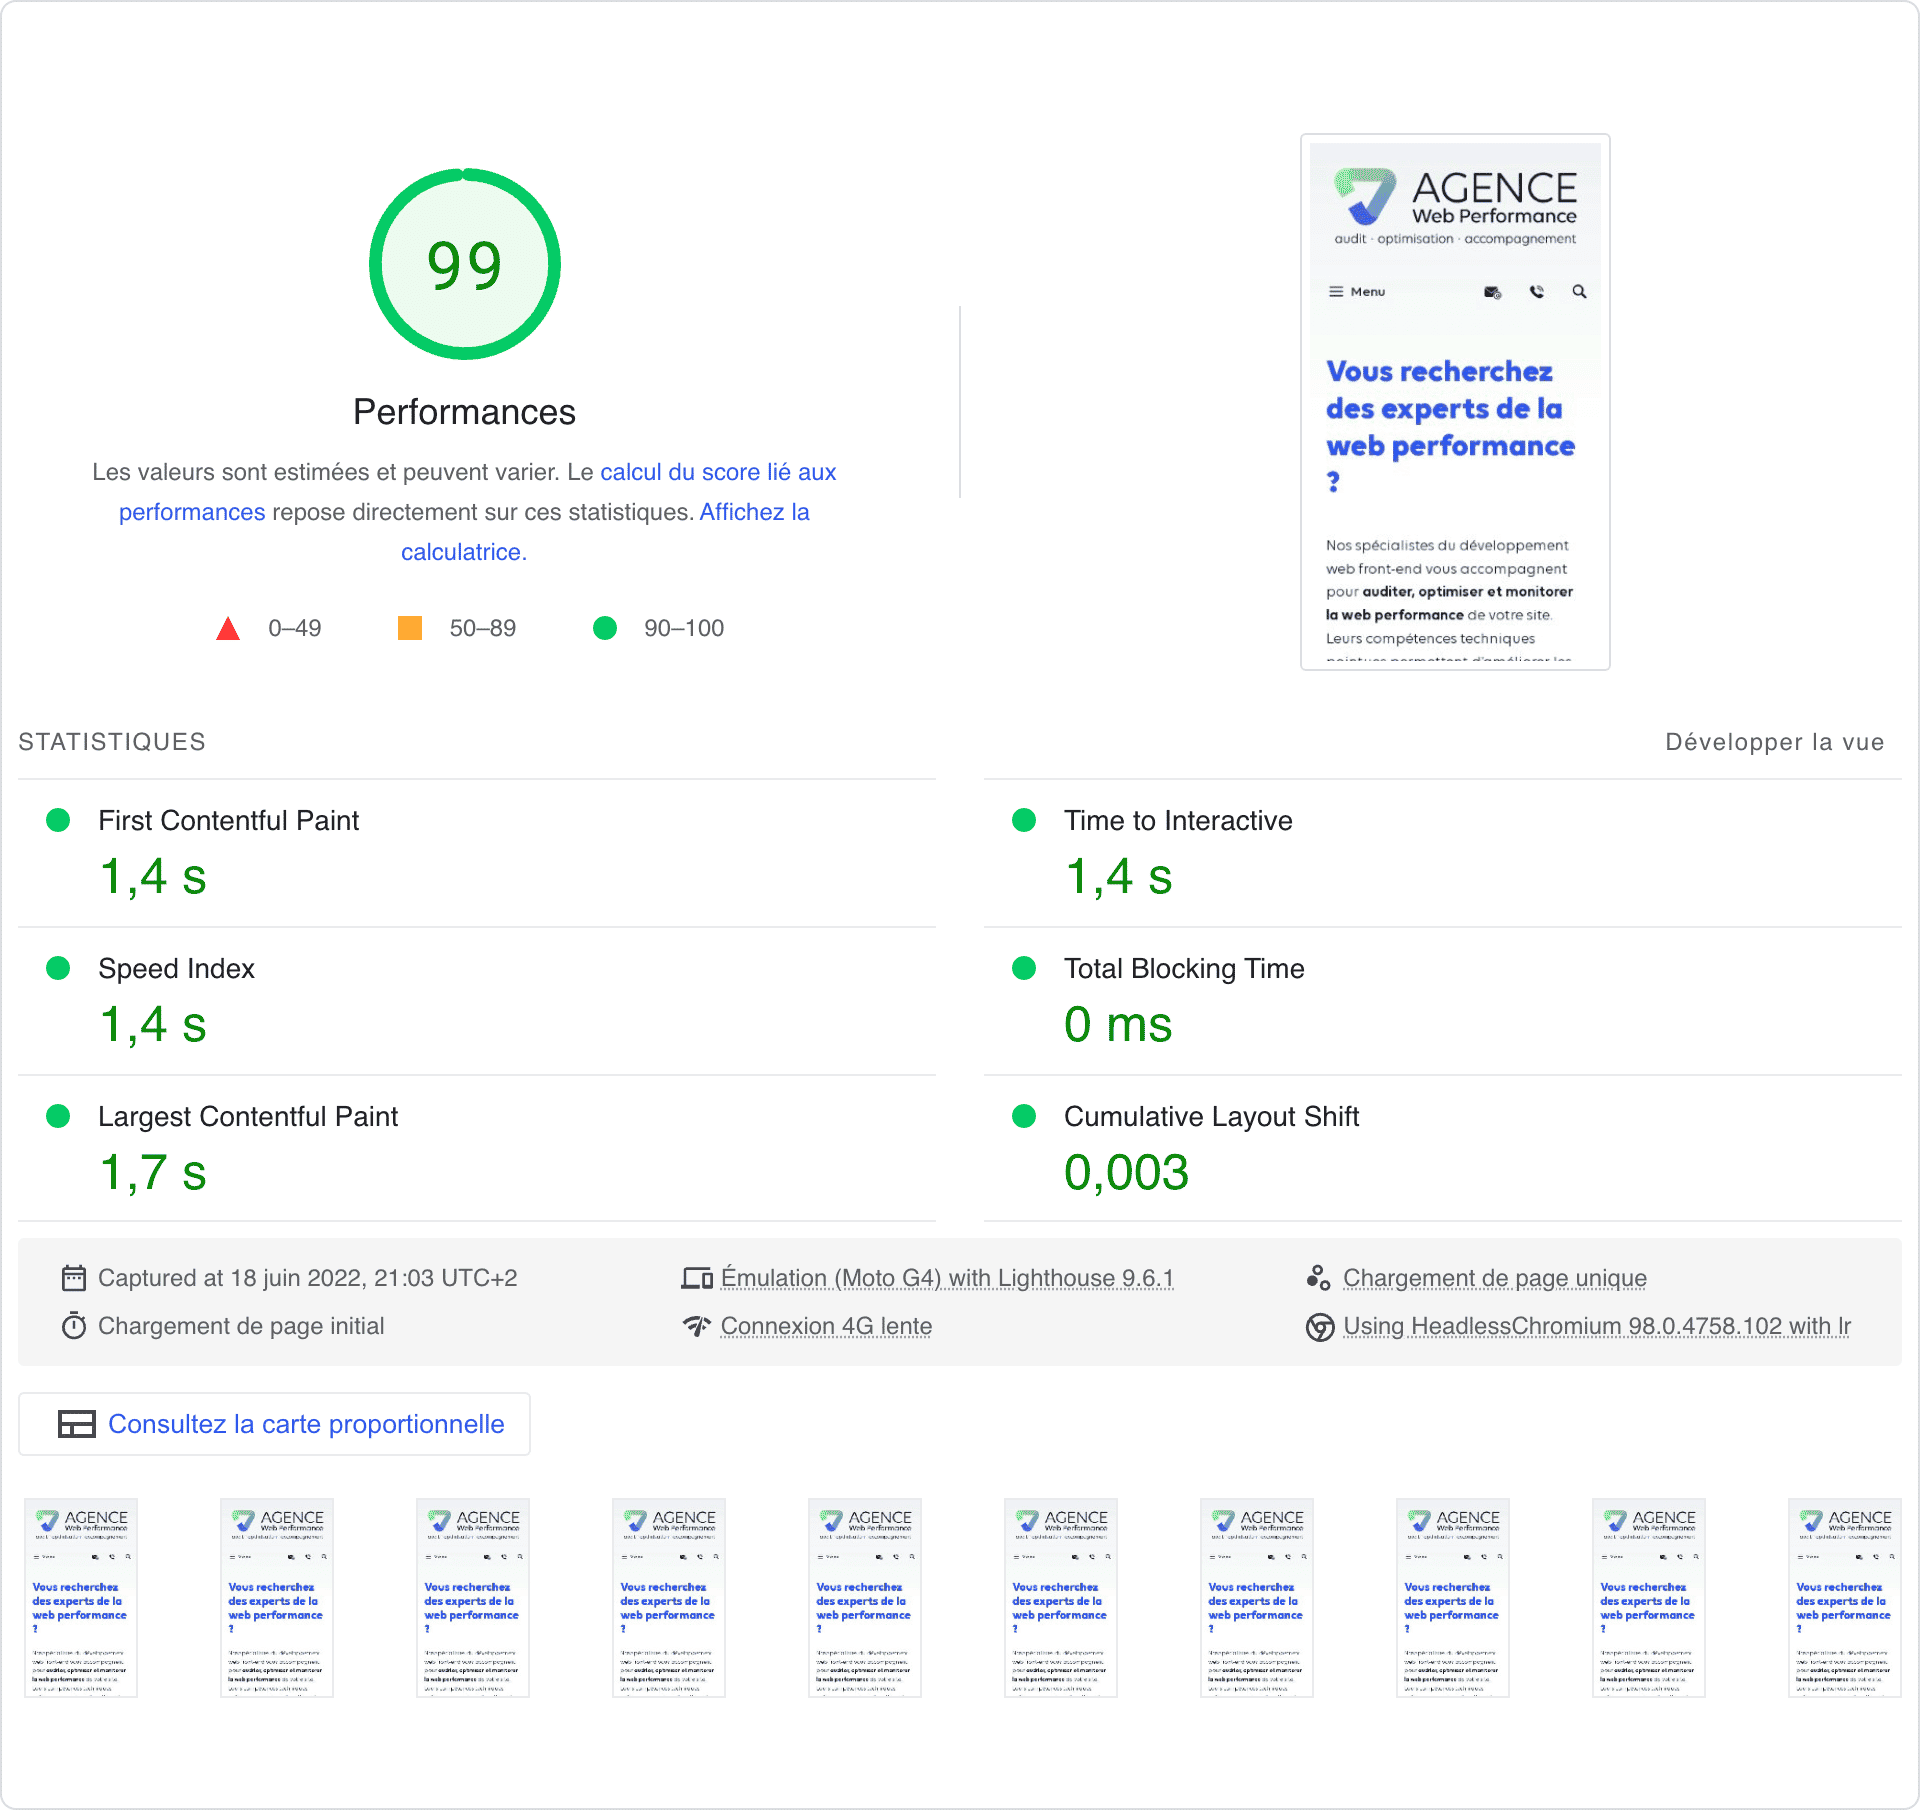
Lighthouse
Another essential tool in the Google ecosystem, it is accessible directly via the Chrome browser developer tools. The recommendations are the same as in PageSpeed Insights, with additional sections dedicated to accessibility, SEO, or applications.
GTmetrix
An independent and paid tool, GTmetrix offers more advanced analysis features than Google's tools. It is also usable for monitoring sites at regular intervals, thus tracking optimization work and detecting potential regressions.
WebPageTest
Webpagetest is a sophisticated and technical tool ideal for understanding a site's performance issues. It is particularly highly regarded for its detailed visualization of the loading waterfall, and for its multiple features in the paid version.
Real User Monitoring tools
RUM-type SaaS tools are fewer and less popular, and for good reason: they require deployment before they can provide data, and their operation involves significant costs that are reflected in the selling price of existing packages. This was without counting on Google, him again, which collects, consolidates, and freely shares the largest field database for web performance: the Chrome User Experience Report, or CrUX. Its French translation is rarely used: Rapport d’expérience utilisateur Chrome.
What is CrUX?
CrUX, or the Chrome User Experience Report, is the public database where Google aggregates performance metrics collected from Chrome users. It is the official source of Core Web Vitals used for page evaluation, and the one that PageSpeed Insights displays in its field data section.
CrUX gathers data collected by users of the Google Chrome browser who are signed into a Google account. This is done automatically and transparently, without any action from users or site publishers. The result is a goldmine that Google uses both in its tools for publishers (Search Console, Lighthouse, PageSpeed Insights) and in its ranking algorithms.
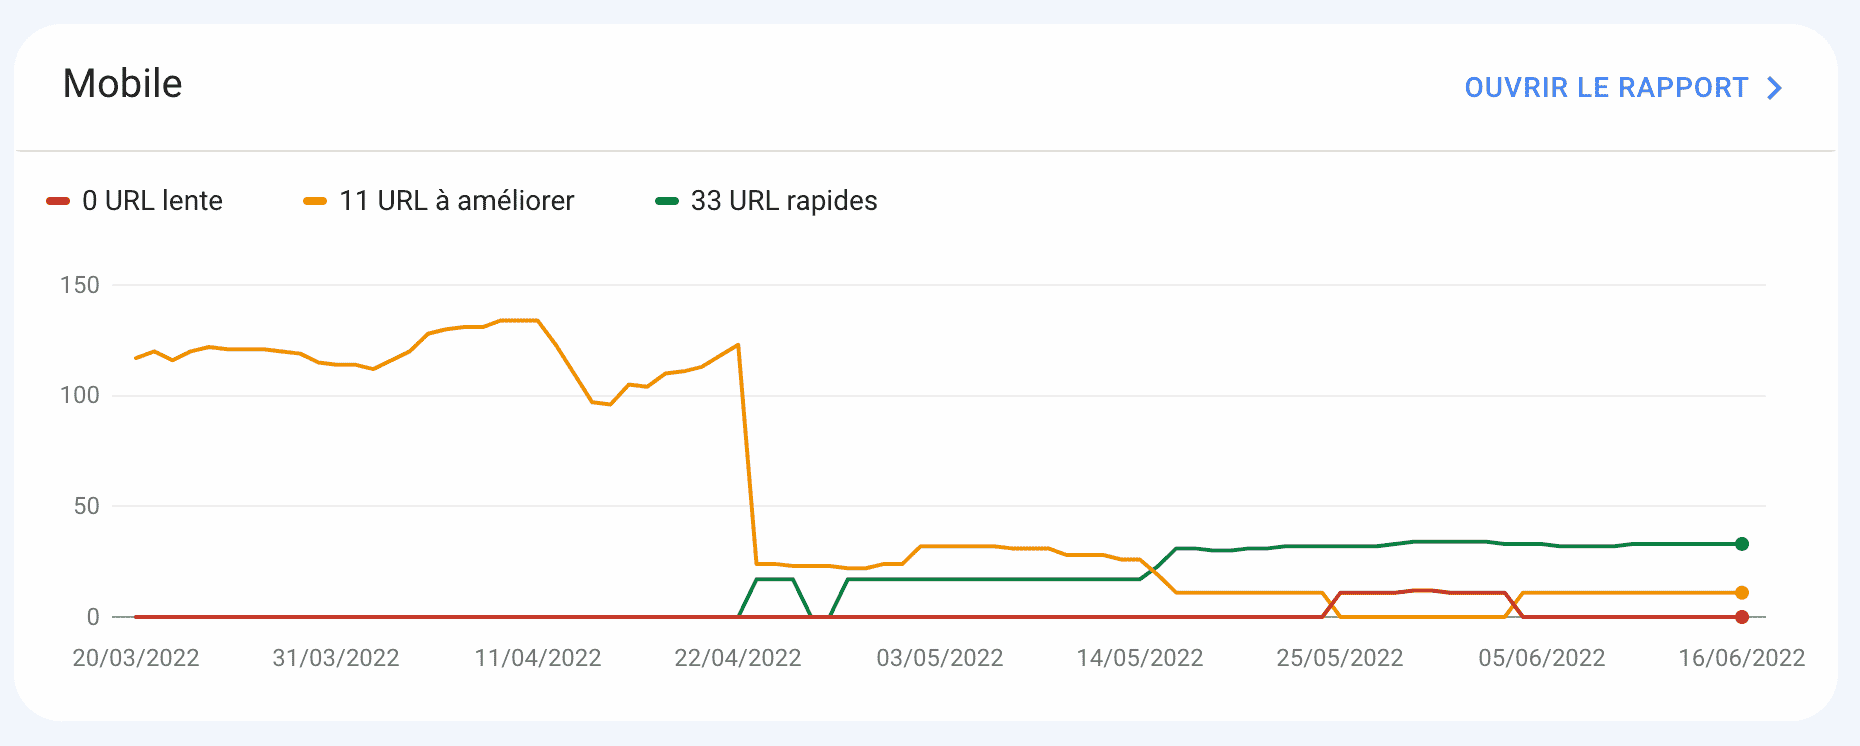
CrUX data is thus literally your web performance scores in Google's eyes. This is a first: since the disappearance of Pagerank, Google has never shared data used as-is within its ranking algorithms. While their impact remains negligible for most queries, it remains one of the few levers that can be improved by visualizing the impact from Google's perspective.
What other RUM tools for web performance?
If you want to collect information from your real users without being limited to the browsers supported by CrUX, there are several solutions: SpeedCurve, Raygun, Contentsquare, or appYuser. Keep in mind that they will all be paid, with plans or contracts based on the volume of page views monthly or annually. For large e-commerce sites, this can quickly represent a significant budget. Solutions backed by Application Performance Monitoring (APM) can prove relevant for reducing costs as part of a comprehensive monitoring strategy (frontend and backend).
How to improve web performance?
Improving web performance requires acting in order: first measure in the field to know what is blocking, then correct the most costly bottleneck, and finally verify the effect on the same indicators. The order matters as much as the fixes themselves, because optimizing an image is useless if the server responds in two seconds.
Web performance is a technical discipline that must be taken into account very early in the site creation process, just like accessibility, SEO, or security. To be sure of having a fast-loading site, it is therefore essential to address the issue from the moment the specifications are written. Technical choices regarding the stack (framework, SSR solution, server architecture, etc.) and specific developments can then be adapted to achieve the set objectives regarding average page weight or any other performance indicator (FCP, Speed Index, Blocking Time, etc.).
Turn to a web performance specialist
Obviously, this approach is still rare, and most websites continue to be put into production without any focus on web performance, even by large, renowned web agencies. Optimizing web performance to achieve objectives set late is then often a challenge, especially for development teams who often do not master the subject.
The solution is to turn to specialists to carry out a performance audit, or if possible, a performance optimization. We offer this type of service, with always very interesting gains thanks to tools and methodologies developed over years of experience. The distribution of optimizations follows Pareto's Law, with 80% classic optimizations and 20% more specific ones resulting from technical choices specific to each client. It is in this last segment that an expert's perspective brings the maximum added value, allowing ambitious objectives to be met.
Upskill your teams or your provider
The other solution is to address the issue at its source: front-end developers. Whether through watching free videos, reading articles and references like Web.dev, or through in-depth training, the idea is to lay the groundwork for them to acquire the right reflexes and habits. This should be supplemented by regular monitoring, as the technical environment evolves very regularly: CSS, HTML, and JavaScript standards, web browsers, frameworks, tools, SaaS solutions, etc.
This is the best way to create a performance culture within technical teams, but also transversally on the business, marketing, or UX/UI side. All these profiles indeed have a role to play in improving page speed, whether through their development, the choice of third-party tools, or the design of interfaces and tools.
What to remember about web performance
As you will have understood by reading this article: web performance is a subject as vast as it is specialized. KPIs, tools, and methodologies exist but remain generally poorly understood and mastered. Even front-end developers, who use the same languages and tools daily as web performance experts, are still too numerous to ignore the impact of certain choices on loading times or the interactivity of a page. It is they who, day after day, through their freelance or web agency work, contribute to creating the web as we know it, with the aberrations we have to face.
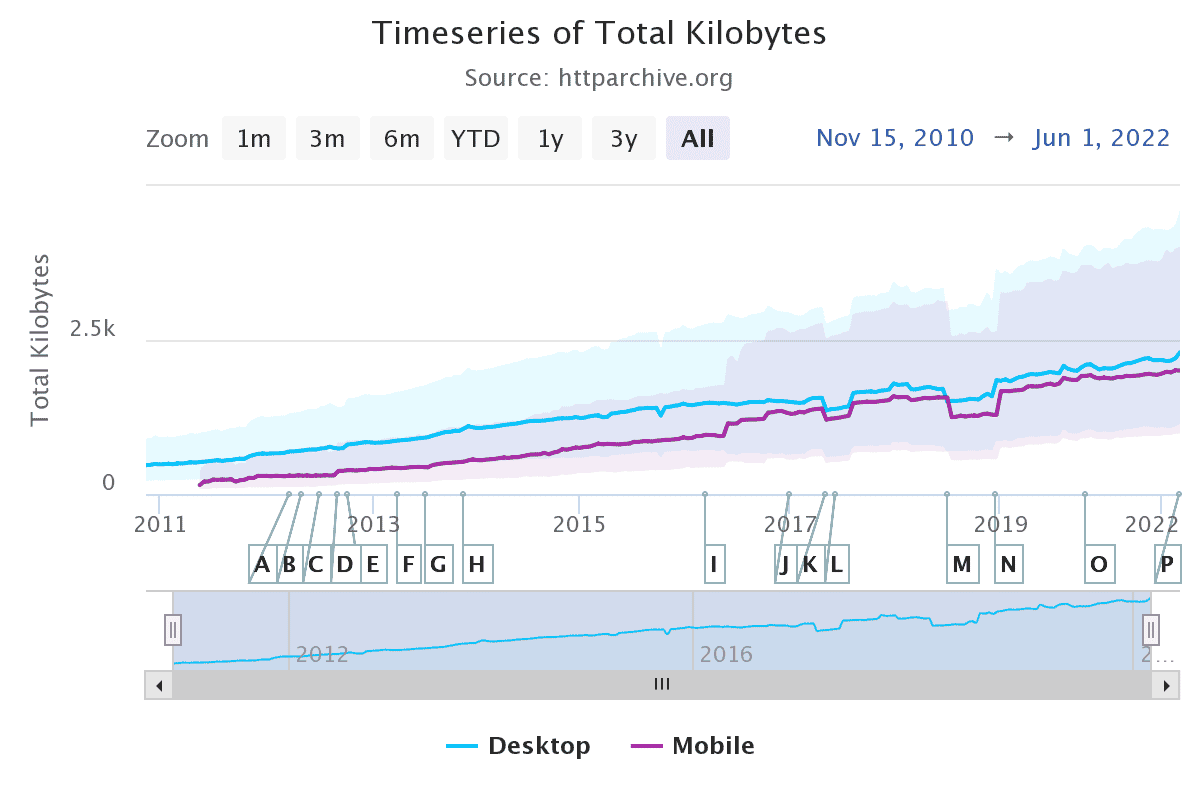
Just as SEO gave birth to SEO agencies, we took the gamble of creating the first agency specializing in web performance. If you wish to undertake projects in this field, do not hesitate to contact us: our specialized expertise is ideal for prioritizing an optimization roadmap, making architectural and tool choices, or helping your teams develop their skills. We are here to build a faster web with you that meets the expectations of your clients and visitors.